By Saul Carliner | STC Fellow and Yuan Chen
Professional development—that is, engaging in activities to build awareness about a job, employer, industry, or economy; maintain skills; and build skills for future positions—is a popular topic among technical communicators. Suggestions about what technical communicators should do to develop professionally, and the opportunities available, have filled pages of Intercom magazine and STC’s Technical Communication journal, been popular topics at STC’s Summit, and have been covered on popular blogs like Tom Johnson’s I’d Rather Be Writing, and other publications and events in the field.
But what do technical communicators actually do to develop themselves professionally? The census explored practices associated with professional development: what technical communicators read, which events they attend, their plans for professional development in the coming year, their certification status, their go-to source of reliable information on the field, and their investments in professional development.
What Technical Communicators Read
Census participants were asked about their use of several types of information sources: social media sites, blogs, magazines and webzines, and peer-reviewed journals.
Social Media Sites
Social media sites let people identify others as “friends” or “links,” join groups of like-minded people, and follow the news and information they share through their posts. Social media is updated all the time, although particular friends, links, or groups might not post regularly.
The census asked which social media sites participants visited frequently (at least once a month in the past 12 months), and which ones they have not visited at all. Table 1 shows the patterns. Participants could add (as write-ins) other sites that they had visited 12 or more times in the past 12 months. Instagram received six or more mentions.
Table 1. Patterns of visits to social media sites.
Percentage of Participants Who Visited the Site at Least Once Per Month the Past 12 Months |
Percentage of Participants Who Had Not Visited the Site at All During the Past 12 Months |
|
|---|---|---|
Wikipedia |
77 percent | 13 percent |
|
|
73 percent | 18 percent |
Facebook groups |
47 percent | 40 percent |
|
|
83 percent | 8 percent |
LinkedIn discussion groups |
42 percent | 43 percent |
|
|
44 percent | 42 percent |
STC Body of Knowledge |
21 percent | 66 percent |
|
|
17 percent | 68 percent |
In general, social media sites were the most followed among all types of media consumed by technical communicators: just 3 percent of participants said they had not visited a social media site in the past year and 5 percent had not visited any of the sites listed.
Blogs
Over the past decade or so, blogs have emerged as popular sources of professional information. Some have a sole author; some represent an organization. Some publish new posts one or more times a week; some go weeks or months between posts. Some have a large following; others have an occasional following.
The census asked which blogs participants visit frequently (six or more times in the past 12 months); and which ones they have not visited at all. The most visited included:
- I’d Rather Be Writing (33 percent had visited six or more times in the past 12 months; 20 percent had not visited at all in the past 12 months)
- The Content Wrangler (25 percent of participants had visited six or more times in the past 12 months; 26 percent had not visited at all in the past 12 months)
- Scriptorium (11 percent of participants had visited six or more times in the past 12 months; 41 percent had not visited at all in the past 12 months)
Many participants added (as write-ins) blogs that they had visited at least six times in the past 12 months but that were not listed. Two received five or more mentions: Every Page Is Page One and Grammar Girl.
Note, however, that 46 percent of participants had not visited any blog in the past 12 months.
Professional Magazines
Although blogs are among the newest sources of professional communication, organizations continue to publish traditional media—magazines and webzines that are led by an editor and have many contributors. Most follow a regular publication schedule. Magazines typically publish every month or two; webzines typically publish new articles weekly or monthly. Professional magazines have the second-longest history within the profession. For example, STC’s Intercom is in its third decade as a magazine and was published as a newsletter for several decades prior to that.
The census asked which professional magazines participants visit frequently (five or more times in the past 12 months), and which ones they have not visited at all. The most visited included:
- Intercom (52 percent had visited five or more times in the past 12 months; 6 percent had not visited at all in the past 12 months)
- Techwriting Today (8 percent of participants had visited five or more times in the past 12 months; 52 percent had not visited at all in the past 12 months)
Less than 5 percent of participants had visited other magazines and webzines, like Learning Solutions, Communication World, and User Experience, five or more times in the past 12 months. By contrast, 58 percent or more of participants had not visited these three magazines and webzines at all in the past 12 months. Participants could write in other magazines or webzines that they had visited five or more times in the past 12 months; none received five or more mentions.
In addition, 39 percent of participants had not visited any professional magazine or webzine in the past 12 months.
Peer-Reviewed Journals
Peer-reviewed journals typically publish research and theory. They use a structured review process in which experts in the area of a proposed article weigh in on whether the journal should publish it. Because of the focus on research and the rigor of the peer-review process, these are preferred publications of academics (in fact, academic faculty are evaluated on the number of articles they publish in peer-reviewed journals). Most peer-reviewed journals say, however, that they also have an audience of practicing professionals. Peer-reviewed journals have the longest history in the profession; two (including STC’s Technical Communication) are well into their seventh decade of publication. A typical peer-reviewed journal publishes between one and four issues per year.
The census asked which peer-reviewed journals participants read frequently (three or more times in the past 12 months), and which ones they have not visited at all. Table 2 shows the readership of the major journals in technical communication: the percentage of participants who had read three or more issues in the past 12 months and the percentage that had not read any issues in the past 12 months.
Table 2. Readership of peer-reviewed journals.
Journal |
Percentage of Participants Who Read 3 or More Issues in the Past 12 Months |
Percentage of Participants Who Had Not Read at All in the Past 12 Months |
|---|---|---|
Business and Professional Communication Quarterly |
3 percent | 34 percent |
Communication Design Quarterly |
4 percent | 34 percent |
International Journal of Business Communication |
3 percent | 35 percent |
Information Design Journal |
2 percent | 35 percent |
Journal of Business and Technical Communication |
5 percent | 32 percent |
Journal of Technical Writing and Communication |
8 percent | 28 percent |
IEEE Transactions on Professional Communication |
10 percent | 28 percent |
Programmatic Perspectives |
2 percent | 35 percent |
Technical Communication |
28 percent | 10 percent |
Technical Communication Quarterly |
7 percent | 28 percent |
Participants could write in other peer-reviewed journals that they had visited three or more times in the past 12 months; none received three or more mentions. Significantly, 62 percent of participants had not visited any peer-reviewed journal three or more times in the past 12 months.
In general, peer-reviewed publications were the least followed among all types of publications. Although 3 percent of participants said they had visited all journals at least three times in the past 12 months, 62 percent of participants had not visited any.
What Technical Communicators Attend
Events provide professionals with the opportunity to interact directly with one another, either face-to-face or through virtual technology. The census specifically asked about the extent of participation in two types of events: conferences and meetings (which included webinars).
Conferences
Conferences are periodic events that bring together many professionals in the field to become inspired, learn about the latest developments, and network with other professionals. Conferences typically run one to three days; some include half- and full-day educational workshops before or after the event. Because of the expense of attending conferences—most involve a registration fee, as well as travel and lodging expenses—many technical communicators attend conferences less frequently than once a year.
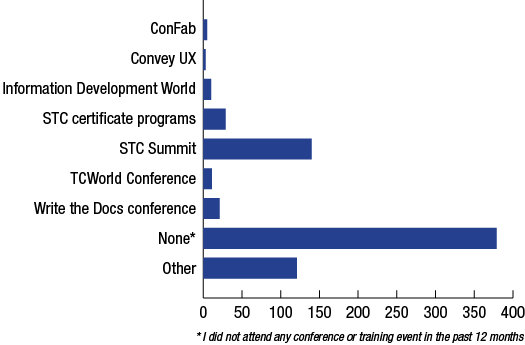
Recognizing that many technical communicators might not have the opportunity to attend an event each year, the census asked which events they had attended in 2017 and 2018 (the past two years). The most attended events were STC Summits, which 21 percent of participants had attended in 2017 or 2018. The next most attended events were STC certificate programs, in which 4 percent of participants participated. Fewer than 3 percent of participants had attended the rest of the events listed. Participants could also write in the names of events not listed. Several had five or more mentions, including: Australian Society for Technical Communication Conference, Center for Information Development Management (CIDM) conferences, IEEE ProComm (professional communication conference), Lavacon, Madworld, and several STC regional conferences including Interchange (New England), Spectrum (Rochester), and STC India.
Half of participants (50 percent) did not attend any conference in 2017 or 2018
Meetings
Meetings are brief events of one to three hours that bring together people with shared professional interests. Some are organized around a topic and might include a formal program with a guest speaker. Others are organized for networking and primarily focus on introducing people and providing them with an opportunity to speak. Some meetings are formally organized by organizations like geographical communities and Special Interest Groups of STC; others are organized more informally, such as meet-ups organized by one or two people and promoted through social media. Many organizations hold meetings several times a year; other types of events are one-offs. Some meetings occur in person, while others occur online, such as webinars.
The census asked participants about the extent of their participation in meetings. Because many choices are available, the census asked whether participants had attended at least one meeting in the past 12 months.
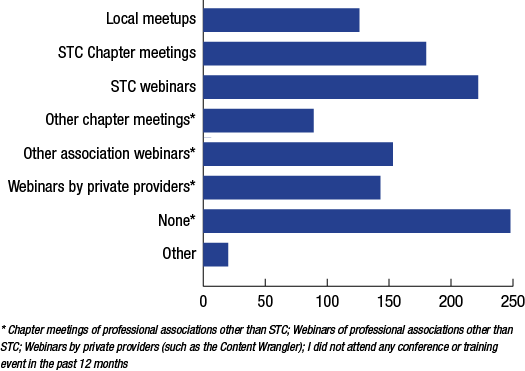
STC webinars were the most-attended events, with about a third (33 percent) participating. STC Chapter meetings were next most-attended, with 27 percent participating. Webinars of professional associations other than STC and by private content providers like the ContentWrangler were also popular, with 23 percent and 21 percent participation, respectively. In addition, 13 percent participated in STC geographical community meetings. Participants could also write in the names of other events they attended, but none received more than five mentions.
Furthermore, a bit more than a third of participants—37 percent—had not attended any meetings in the past year.
Plans for Professional Development
In addition to exploring the professional development in which technical communicators have participated in the past year, the census also looked ahead at plans for professional development in the coming year. The census specifically asked participants whether they plan to participate in formal training or education in the next 12 months. Table 3 shows the responses.
Table 3. Professional development plans in the next 12 months.
Do you plan to participate in any formal training or education over the next 12 months? |
Percentage |
|---|---|
Yes |
36 percent |
No |
36 percent |
No response |
28 percent |
The census asked those who indicated that they planned to pursue training or education in the next 12 months about the training or education opportunities they plan to pursue. The largest percentage (21 percent of all participants in the survey) indicated that they plan to take a course offered by a professional association. Another 17 percent plan to take a course from a private provider. Among the options written in for “Other,” nearly half identified self-study options, including online courses by private providers, DIY-training through YouTube, and books. Table 4 shows the education and training options that technical communicators plan to pursue in the coming year.
Table 4. Education and training options that technical communicators plan to pursue.
How do you plan to pursue this training or education? |
Percentage |
|---|---|
Formal degree program |
5 percent |
Academic course |
7 percent |
Course offered by my employer |
9 percent |
Course offered by a professional association like STC or ATTW |
21 percent |
Course offered by a private provider like the Content Wrangler or Coursera |
17 percent |
Other [write-in] |
10 percent |
Certification
In recent years, interest in certification—the validation of competence in a particular field by a third party—has grown and, along with it, the number of certifications available. STC relaunched its most current certification program in 2016. Unlike licenses, which people must have to legally work in a field, certification is voluntary.
Of those participating in the census, 17 percent have at least one certification and another 14 percent seek certification in the next year. The census did not ask participants to identify the certification they held or were seeking, and thus those responses can represent any certification.
Go-To Source
Of all the sources of information explored—social media, blogs, professional magazines, peer-reviewed journals, conferences, and meetings—on which sources do technical communicators rely most? The census also asked participants to identify their “go-to source” among all of the sources of information. Books are the top “go-to” source, while blogs are the top second “go-to” source. Table 5 lists participants’ top two “go-to” sources of material.
Table 5. Top two “go-to” sources.
Source |
Number 1 “go-to” source |
Number 2 “go-to” source |
|---|---|---|
| Blogs | 7 percent | 10 percent |
| Books | 13 percent | 7 percent |
| Events (training classes, webinars, conference, and meetings) | 6 percent | 7 percent |
| Magazine/webzines | 5 percent | 5 percent |
| Journals | 6 percent | 3 percent |
| Social media | 3 percent | 5 percent |
| I do not have any “number 1/2 go-to” source. | 46 percent | |
Investments in Professional Development
Professional development requires funding and time to complete. So the census explored the investments made in professional development: who covers professional development costs—workers or employers—as well as how much time and money technical communicators personally invest in their professional development.
Who Pays?
Several decades ago, employers were expected to cover all of the costs of professional development. That expectation has shifted in recent decades, with a growing understanding that workers and employers each contribute. But to what extent?
According to data provided in the census, either the communicator or the employer tend to cover an expense in its entirety; sharing is much less common. Employers seem most likely to cover membership dues and training expenses (41 percent and 36 percent respectively). By contrast, technical communicators seem most likely to cover their own membership dues and publication subscriptions (39 percent and 31 percent respectively). But large percentages of technical communicators covered no publications expenses (40 percent) or conference expenses (48 percent) in the past year (both hinted at by data reported earlier).
Table 6 reports on who covered different types of professional development expenditures.
Table 6. Who pays for professional development expenses.
Expenditure |
I paid |
My employer paid |
We shared costs |
No expenditures in the past 12 months |
|---|---|---|---|---|
| Publication subscriptions | 31 percent | 24 percent | 2 percent | 40 percent |
| Membership dues | 39 percent | 41 percent | 2 percent | 15 percent |
| Conference attendance | 14 percent | 29 percent | 5 percent | 48 percent |
| Training | 21 percent | 36 percent | 5 percent | 24 percent |
| Other | 20 percent | 9 percent | 3 percent | 64 percent |
Personal Funds Invested
If technical communicators need to invest their own funds in professional development, how much are they actually investing? The census explored this issue, too. The largest percentage (31 percent) spend $250 USD or less per year. The next largest percentage (16 percent) spend $251 to $500 USD per year. To put this spending in perspective, STC membership hovers near $225 per year (actual cost varies depending on a number of factors), while some private conferences have registration fees that exceed $1,500 USD (and that’s before travel and lodging costs). Table 7 shows the personal investments made by technical communicators in their professional development.
Table 7. Amount of personal funds invested in professional development.
How much of your own funds did you invest in your professional development in the last 12 months? |
Percentage |
|---|---|
| $1–$250 USD | 31 percent |
| $251–$500 USD | 16 percent |
| $501–$750 USD | 7 percent |
| $750–$1,000 USD | 8 percent |
| $1,001–$2,500 USD | 6 percent |
| $2,501 USD or more | 5 percent |
Time Invested
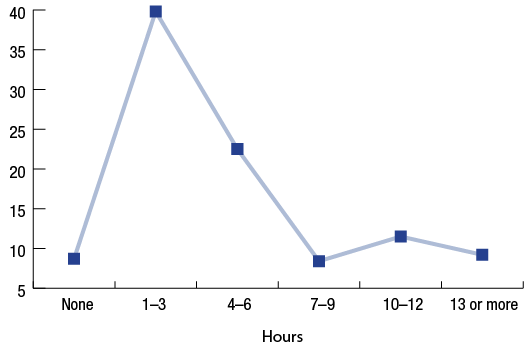
Professional development takes time: Time to attend conferences and meetings, participate in social media, and read publications. The census inquired about the amount of time that technical communicators invest in this activity. The census specifically asked participants how much time they spent per month in professional development activities. The largest group, 40 percent, spent one to three hours per month. The second largest group, 22 percent, spent four to six hours. Nine percent of participants spent 13 hours or more in professional development and nearly another 9 percent spent no time monthly in professional development.
Figure 3 shows the extent of participation in professional development by technical communicators.
What Does This Mean?
This basic analysis of the professional development practices of technical communicators suggests the following:
- Social media sites are the most widely visited sources of professional information, followed by blogs. Among census participants, STC publications still have great value, but interest in other publications is low. Wikipedia seems to be a more relied-upon source than the journals in our field.
- Fewer than half of the census participants attend events. Of those who do, online events are among the most popular, especially webinars, which are the most popular types of events overall.
- Participants favor training and education from professional associations and private providers over academic programs. That finding seems reasonably consistent with the finding reported earlier that the population skews a bit older. Furthermore, the significant number of mentions of self-study options suggests that informal learning—a topic of great interest in training and development—is actively pursued by technical communicators.
- The extent to which technical communicators have certification or plan to become certified in the next few years seems consistent with research in the 1980s and 1990s, indicating that members of the field are split on this option. Within the industry in general, however, interest in certification is growing as a means for people to demonstrate their competence in a particular skill family.
- The levels at which technical communicators invest time and funds in professional development seems somewhat consistent with broader studies of the workplace. The Conference Board of Canada asked workers in general about the amount of time they invest in informal learning and the amount of funds they invest. Technical communicators are consistent with investments in professional development but invest a bit more time than the average worker (though the questions were asked differently, so that might explain the differences).
The census also suggests a major concern. Although many participants in the survey actively participated in professional development, large percentages indicated that they did not read much of the professional literature, attend events, or plan to pursue training in the coming year. If we believe that the field is constantly changing, sitting out of professional development for even a year or two could pose longer-term challenges.