Abstract
Purpose: The market for (paid-for) commercial software manuals is flourishing, while (free) official manuals are often assumed to be neglected by users. To investigate differences in user perceptions of commercial and official manuals, we conducted two studies: one focusing on user expectations and one on user experiences.
Method: The first study was an online experiment, in which two groups of participants answered questions about their expectations of a (commercial or official) manual. The second study was a 2×2 experiment, with perceived source (commercial or official) and the actual content of the instructions (commercial or official) as independent variables, and task performance and users’ judgments as dependent variables.
Results: The first study showed that users have different expectations of commercial and official manuals, and overall think more positively about a commercial manual. The second study showed that perceived source had a significant effect on task performance: Participants worked better when they thought they used a commercial manual. No differences were found regarding participants’ judgments of the manual.
Conclusion: Our research indicates a potential image problem of official user manuals. Even though we found no evidence for a lower quality of the official manual’s content, users’ relatively negative expectations of an official manual may discourage them from using the official user instructions. The second study showed that the perceived source (commercial/official) may even affect the actual task performance of users.
Keywords: image, manual, not reading, user documentation, user guide
Practitioner’s Takeaway:
- Official software manuals appear to suffer from a relatively bad image, which may negatively affect people’s inclination to actually use these manuals.
- Users’ expectations regarding official manuals are less positive regarding connection with real-life tasks, language and instructions, and layout.
- Users’ expectations regarding official manuals tend to be more positive regarding expertise of the writer(s).
- Irrespective of their content, commercial manuals may lead to better task performance due to a better image than official manuals.
- It seems worthwhile to explore ways of making official manuals stand out more, for instance by using quality marks or making them explicit product assets.
Introduction
Although the field of technical communication has broadened considerably, providing user support remains one of the core tasks of technical communicators. Recent literature shows that the nature of user support is changing, with more attention to instructional videos (e.g., Swarts, 2012; Van der Meij & Van der Meij, 2013; Ten Hove & Van der Meij, 2015) and user forums (e.g., Frith, 2014; Swarts, 2015), but manuals and user guides are still most prevalent. For several decades, technical communication scholars and practitioners have worked on the optimization of written user instructions (Van der Meij, Karreman, & Steehouder, 2009). Despite these efforts, there is not always much optimism among practitioners about the extent to which manuals, user guides, and other types of user documentation are actually used (Rettig, 1991; Svenvold, 2015).
It is important to realize that the option to use a manual is one that has to compete with many alternatives people have, most notably exploring by themselves, asking other people for advice, and searching the Internet. Schriver (1997, p. 166), for instance, argued that “most people choose to read and to keep reading only when they believe there will be some benefit in doing so and only when they cannot get the same information in an easier way (for example, by asking someone else).” However, she also presented survey results showing that a large majority of consumers use manuals to some extent when they try out new functionality of products, although they seldom read them cover-to-cover (pp. 213–214), and that consumers see a clear instruction manual as an important asset of products (p. 223). She also found that participants quite often assign the blame to the manual when experiencing difficulties with a product (pp. 217-222), which, of course, is not a positive finding but nevertheless suggests an important role of manuals from the users’ perspectives.
These findings resonate in various earlier and later studies. Some evidence was found for the potential added value of manuals. Aubert, Trendel, and Ray (2009), showed in an experiment that pre-purchase exposure to a high-quality user manual positively affects product evaluation and purchase intention. In another experiment, Pedraz-Delhaes, Aljukhadar, and Sénécal (2010) found that users’ evaluation of the documentation affects their evaluations of the product and the company behind the product. Wogalter, Vigilante, and Baneth (1998) focused on the context of reselling used consumer products and found that the availability of a manual would be an asset for selling used products, and that people are even willing to pay extra to have one. Van Loggem (2013) took an analytic approach and argued against the “persistent myth” that well-designed artifacts do not need documentation: In the case of intrinsic complexity, it is impossible that the user interface, no matter how well designed, will suffice to support all functionality.
Regarding the actual use of manuals, the available research led to varying results. Szlichcinski (1979), using a telephone system in a laboratory setting, found that the majority of the participants (83%) did not use the user instructions. Wright, Creighton, and Threlfall (1982), on the other hand, found that a majority of the consumers (66%) read at least some of the user instructions when using electric or nonelectric products. Jansen and Balijon (2003) came up with even higher percentages: More than 70% of their participants indicated to always or often use the manual for products; only 8% reported never using manuals. Van Loggem (2014) provided an overview of earlier studies, with use percentages ranging between 57% and 96%, and presented new data for professionals and students that fell within this range (90% and 70%, respectively). Based on these and Schriver’s results, it seems safe to assume that users at least occasionally refer to user instructions when working with products or tasks that are unfamiliar to them.
Other studies focused on determinants of using user instructions. In a study among senior users (age range 65–75), Tsai, Rogers, and Lee (2012) showed that user manuals play an important role for this age group, particularly for the purposes of better understanding the product, recalling forgotten functions, and preventing mistakes. In a comparative study, Lust, Showers, and Celuch (1992) showed that seniors use manuals significantly more than younger users. The aforementioned difference Van Loggem (2014) found between professionals and students seems to point in the same direction, as the difference between the two groups has an age dimension. Given the drastically changed media landscape, the difference between old and young users may have increased in recent years and may further increase in the future.
More intrinsically, Wright, Creighton, and Threlfall (1982) found that users’ estimation of the complexity of operations strongly affects their reading intentions. In the same vein, Wiese, Sauer, and Rüttinger (2004) found that product complexity is the best predictor of manual use. Celuch, Lust, and Showers (1992) showed that prior experience and time considerations are variables distinguishing readers from nonreaders. Finally, Lust, Showers, and Geluch (1992) found a broader range of predictors, including people’s general perceptions of manuals.
In the research reported in this article, we will explore people’s perceptions of manuals more extensively by focusing on the source credibility of manuals. Our research was inspired by the observation that users may, to some extent, be reluctant to use the official manuals of software packages but at the same time be willing to pay for a commercial manual for their software (cf. Van Loggem, 2013). One can think of the “For Dummies” series (e.g., Excel for Dummies), the “Bible” series (e.g., Excel 2016 Bible) published by John Wiley, or the “Missing Manuals” series (e.g., Excel 2013. The Missing Manual) published by O’Reilly. This seems to indicate that the source of the manual (official versus commercial) plays a role in users’ views of manuals. So far, the technical communication literature has not addressed how users perceive such source differences. Coney and Chatfield (1996) conducted analytical research into the differences between both types of manuals and proposed that “the determining factor in the appeal of third-party manuals […] is the rhetorical relationship between the authors and their audience” (p. 24). Investigating users’ expectations and experiences with official and commercial manuals may shed light on user perceptions.
In two separate experiments, we investigated the effects of source (official versus commercial manual) on users’ expectations and experiences. In the first experiment, we focused on the expectations users have when they are confronted with an official or a commercial manual. The second study was a 2×2 experiment, in which we manipulated the source of the information and the actual content to investigate the effects of perceived source on the experiences of users. The two studies were approved by the IRB of the University of Twente.
Image, Source Credibility, and User Instructions
It is very common that we form mental images of phenomena we encounter. We use such mental images to simplify and make sense of the world we live in, for instance, when making behavioral decisions. Images can be based on prior experiences, hearsay, or associations, and can have varying degrees of elaboration—from overall impressions (low), to a number of specific beliefs that lead to an overall attitude (medium), to a complex network of meanings (high) (Poiesz, 1989). In practice, we can form images at various levels. Hsieh, Pan, and Setiono (2004), for instance, distinguish between product, corporate, and country image, which may simultaneously affect purchase behavior. The assumption in our study is that software manuals will have a certain image among users, but that it may be fruitful to differentiate between official and commercial manuals.
This is related to the literature about the effects of source credibility. Research shows that source credibility plays an important role in the way people handle information. In the context of persuasive communication, research suggests that people may be more effectively convinced or persuaded when the source of information is perceived to be credible (Pornpitakpan, 2004). Johnston and Warkentin (2010) showed positive effects of source credibility on people’s intentions to follow recommended IT activities—a context that is in fact closely related to that of user instructions. Other studies found that source credibility may affect people’s willingness to expose themselves to information. For instance, Knobloch-Westerwick, Mothes, Johnson, Westerwick, and Donsbach (2015) showed that source credibility, operationalized as the difference between official institutions without self-interest in the issue at hand versus personal bloggers, affects people’s time spent on Internet messages about political issues. Winter and Krämer (2014) showed that source credibility positively affects people’s decisions about which Internet sources they will read and to what extent they will read them. In their study, source credibility was manipulated by source reputation as well as by the ratings of others.
The effects of source credibility may be further explored by connecting them to the broader concept of trust (cf. Mayer, Davis, & Schoorman, 1995). Two important factors that are distinguished are competence—in the case of user manuals, this boils down to software expertise and technical communication competencies—and benevolence—a perceived willingness to serve the users and their needs.
Study 1: Users’ Expectations
Our first study aimed at investigating users’ expectations of official and commercial manuals. To do so, an online experiment was designed, with two conditions (official versus commercial manual), in which participants had to answer questions about their expectations of the manual. The research focused on Microsoft Excel.
Method
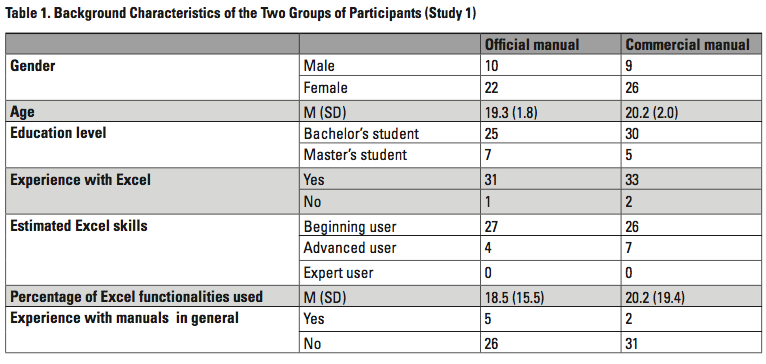
Participants The sample consisted of 69 students from the University of Twente. The students received participant credits for participating (students in the first years of our program are required to act as participants in a number of studies). They were randomly assigned to one of the two conditions. Table 1 provides the background characteristics of the two groups of participants. Differences between the two groups were tested, and there was no significant difference found for any of the background variables.
Manipulation One group of participants was exposed to the official manual (Microsoft Excel 2010 Official Offline Help Manual), and the other group to a commercial instruction book (Excel 2010 For Dummies). The manipulation consisted of three images, presented side by side: the cover, the table of contents, and a random page of the instructions. Both versions were equally long, contained one color page and two black-and-white pages, and were representative for the look and feel of both types of manuals.
Procedure Data were collected using Qualtrics, a tool for online surveys and experiments. The first screen provided an introduction to the research. Participants were told that they would be exposed to a software program plus manual, and that their thoughts about the manual were the focus of the research. They were informed that they would not have to read the manual for the research. The second screen provided basic information about Excel, including a screenshot. On the third screen, the manual version was presented. After that, questions about the manual were asked, chunked on different screens.
Instrument All constructs in the questionnaire were measured using five-point Likert scales. Above all sets of questions, the following overall instruction was given: “Imagining using this manual, what do you think the manual will be like?” Seven constructs were included in the research: connection to real-life problems, ease of locating information, expertise, language and instructions, layout, redundancy, and source preference. These constructs were meant to reflect different aspects of competence and benevolence, and proved to be statistically distinguishable in a factor analysis (with varimax rotation). Three constructs that were originally included in the questionnaire (assumptions about users, empathy, and quality of the information) were removed because they did not appear to be statistically distinguishable constructs.
The construct connection to real-life tasks involved the extent to which the manual was expected to support realistic tasks that people want to perform with the software. It was measured with two items (two other items were deleted based on the factor analysis) (Cronbach’s alpha = .70). The two items were “This manual connects the functionality of Excel to real-world tasks of users,” and “This manual focuses strongly on what users want to do with Excel.”
The construct ease of locating information focused on participants’ expectations of the findability of information in the manual. It was measured with four items (two items were deleted based on the factor analysis) (Cronbach’s alpha = .81). Examples of items are “I will find the answers to my questions without much effort in this manual,” and “This manual is clearly structured.”
The construct expertise focused on the manual’s writers’ knowledge of the software, and was measured with four items (one item was deleted based on the factor analysis) (Cronbach’s alpha = .77). Examples of items are “The authors of this manual are experts in using Excel,” and “The authors of this manual know different solutions to achieve the same goal in Excel.”
The construct language and instructions focused on the expected quality of the (textual and visual) instructions in the manual. It was measured with five items (three items were deleted based on the factor analysis) (Cronbach’s alpha = .85). Examples of items are “The text of this manual is easy to understand,” and “This manual contains figures and illustrations where necessary.”
The construct layout involved participants’ expectations of the visual appearance of the manual, and was measured with three items (two items were deleted based on the factor analysis) (Cronbach’s alpha = .71). Examples of items are “The layout of this manual is user-friendly,” and “The layout of this manual is inviting.”
The construct redundancy focused on participants’ expectations of irrelevant information and wordiness of the manual. It was measured with four items (one item was deleted based on the factor analysis) (Cronbach’s alpha = .78). Examples of items are “This manual contains a lot of information that is not relevant to users,” and “This manual contains too much information.”
The construct source preference involved the extent to which participants would prefer the manual over other possible sources, and was measured with three items (two items were deleted based on the factor analysis) (Cronbach’s alpha = .79). Examples of (negatively worded) items are “I would prefer to use Google instead of using this manual,” and “I would prefer to use the online help instead of using this manual.”
Results
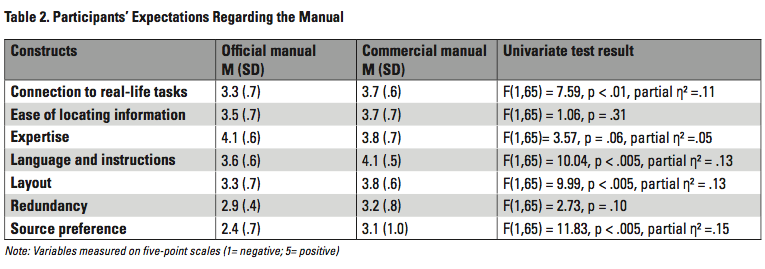
The data were analyzed using a multivariate analysis of variance, with the manual version as independent variable, and the seven expectation constructs as dependent variables. The first step in the analysis involves the multivariate test results, which focuses on the effects of the independent variable on the conglomerate of dependent variables. A significant multivariate test result is required before the univariate effects on separate dependent variables can be examined. This appeared to be the case (Wilks’ lambda = .61, F(7,59) = 5.48, p < .001, partial η² = .٣٩). Overall, the manual version had a strong effect on participants’ expectations.
The second step focuses on the effects of the manual version on the seven dependent variables. Table 2 presents the mean scores in the two conditions and the univariate test results. As can be seen, participants had more positive expectations of the commercial manual for four of the seven dependent variables: connection to real-life tasks, language and instructions, layout, and source preference. The commercial manual was expected to have a stronger connection to real-life tasks, to be more effective in language use and instructions, to have a more appealing layout, and to be a stronger competitor to other possible sources of information than the official manual. The effect sizes (as indicated by the partial η²) refer to practically meaningful effects.
On the other hand, participants tended to have relatively high expectations of the writers’ expertise in the case of the Official manual, as compared to the commercial manual. They expected the writers of the official manual to know more about the Excel software. No differences were found regarding the expected ease of locating information and the amount of redundant information in the manual.
Among the seven dependent variables, source preference can be seen as an indicator of behavioral intentions, as it does not focus on specific aspects of a manual but involves participants’ preferences for the manual compared to other information sources. To test the relationship between the six expected manual properties and source preference, we conducted a linear regression analysis. Surprisingly, the six constructs did not have any predictive value for the participants’ scores on source preference (R2 = .01, F(6,60) = 1.05, p = .40).
Conclusions
The results of the first study suggest that the commercial manual has a better image than the official manual. The findings acknowledge that the writers of the official manual are closer to the software, and thus may have more software expertise, but think that the writers of the commercial manual will do a better job providing them with the information they want. The added value of the commercial manual involves content (connection to real-life tasks) and formulation and visuals (language and instructions, and layout) but not the structuring (ease of locating information) and redundancy. In general, participants would be more willing to use the commercial manual compared to other possible sources than to use the official one compared to other sources (source preference).
Study 2: Users’ Experiences
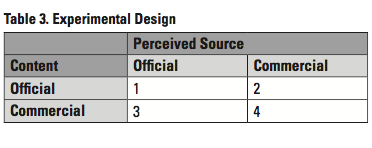 Our second study aimed at investigating users’ experiences using an official or commercial manual. These experiences may be triggered by the actual content of the manual and by the perceived source. We therefore conducted a 2×2 experiment, with content (official versus commercial) and perceived source (official versus commercial) as independent variables (see Table 3). We included both official and commercial content in our experiment, because it is conceivable that the congruence between perceived source and actual content may affect users. Limiting our research to either official or commercial content would then lead to biased results. It must be stressed that a comparison of the effects of official and commercial content is beyond the scope of our research, as we cannot be sure of the representativeness of the specific combination of tasks and instructions for the complete manuals. The dependent variables involved both task performance (effectiveness and efficiency) and participants’ judgments.
Method
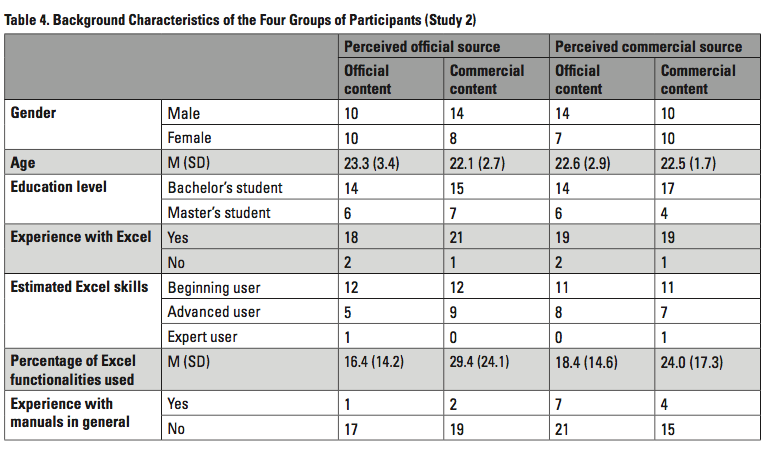
Participants The sample consisted of 83 students of the University of Twente. The participants either received participant credits or a small gift for their participation. They were randomly assigned to one of the four conditions. Table 4 shows the participants’ background characteristics. Only one significant difference in background characteristics was found: Participants in the two conditions with the commercial manual content estimated the percentage of their usage of the Excel functionality significantly higher than participants in the two conditions with the official manual content did (F(1,73) = 5.14, p < .05). However, this background variable appeared to have no significant correlation with any of the dependent variables.
Manipulation The experimental materials were based on the same two manuals as used in the first experiment: the Microsoft Excel 2010 Official Offline Help Manual (official manual) and Excel 2010 For Dummies (commercial manual). We selected the content of both manuals that was relevant for the two tasks. We also added a section on conditional formatting to somewhat complicate the sub task of locating the right information. This amounted to 12–15 pages of text and images. Four versions of the manual were made by combining the communicated source (official versus commercial) and the content (official versus commercial). Text, images, layout, and structure were exactly the same as in the original manuals. Only one small layout change was made: In the version combining the content of the commercial manual and the source of the official manual (condition 3 in Table 3), the font of the headings was replaced with a more official font, to give it a more official look and feel.
Procedure This experiment was conducted in individual sessions in separate, quiet rooms at the university campus, in the presence of a facilitator. The participants were given two tasks with a fictitious “student data” file in Excel. The first task involved restructuring the entire file using the students’ ages as the primary sorting criterion and their last name as the secondary. The second task involved making sure that the name columns (first and last name) and the headings row would always be visible, no matter how far you would scroll down or to the right (this is called freezing panes in Excel).
Participants were encouraged to use the manual when working on the tasks. They were not allowed to use other sources of information, such as online help or the Internet. The maximum time for completing the tasks was 30 minutes. The facilitator kept track of the time during the session. If participants were not able to finish the tasks within 30 minutes, they were asked to stop. After the task execution, participants filled out an online questionnaire regarding their experiences.
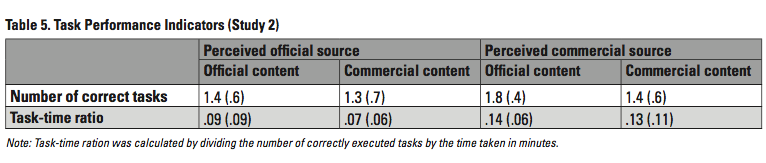
Instrument Two task performance indicators were collected during the task execution: the number of correct tasks—participants could get 0, 1, or 2 points—and the time taken. Participants’ effectiveness was measured using the number of correct tasks; their efficiency was based on their task-time ratio (the number of correctly executed tasks divided by the time taken in minutes).
For the participants’ judgments, the same seven-construct questionnaire was used as in Study 1, this time with Cronbach’s alphas in the range of .61 and .83. One new construct was included, focusing on participants’ overall experience using the manual (four items, Cronbach’s alpha = .86). For this construct, participants were asked to rate their overall experience with the experimental manual using semantic differentials, such as “very positive” versus “very negative,” or “very efficient” versus “very inefficient.”
Results
Task performance Table 5 presents the results regarding the task performance of the participants with the four manual versions. As the two dependent variables are related, we used two separate univariate analyses of variance to test the results for significance. For effectiveness (number of correct tasks), two significant main effects were found. There was a significant effect of perceived source (F(1,79) = 4.23, p < .05, partial η² = .05): Participants who believed that the manual they used was a commercial one outperformed participants who thought they worked with the official manual. There was an opposite main effect of manual content (F(1,79) = 4.23, p < .05, partial η² = .05): Participants working with the official manual content outperformed the participants working with the commercial manual. As said earlier, this result must be treated with caution, as we cannot be sure of the representativeness of the official and commercial manual excerpts for the complete manuals. No interaction effect was found (F(1,79) = .22, p = .43).
For efficiency (the task-time ratio), one significant result was found, regarding the perceived source of the manual (F(1,79) = 8.15, p < .01, partial η² = .09): Participants who thought to work with the commercial manual outperformed the participants who thought they had an official manual. No main effect for manual content (F(1,79) = .63, p = .43) and no interaction effect (F(1,79) = .06, p = .81) were found.
Participants’ judgments The results of participants’ judgments regarding the manual can be found in Table 6. In general terms, there were some remarkable differences and similarities compared to the expectation scores in Study 1. As shown by a series of t-tests comparing the scores of Study 1 and Study 2, the actual judgments were significantly lower than the expectations in Study 1 for the variables expertise (p < .001), language and instructions (p < .005), layout (p < .001), and redundancy (p < .01). The variables connection to real-life tasks, ease of locating information, and source preference had similar scores as those in Study 1.
The scores on overall satisfaction, being an overarching construct, were tested separately using a univariate analysis of variance. No significant effects were found of perceived source (F(1,79) = 2.03, p = .16) and manual content (F(1,79) = 1.84, p = .18), and no interaction effect was found (F(1,79) = .97, p = .33).
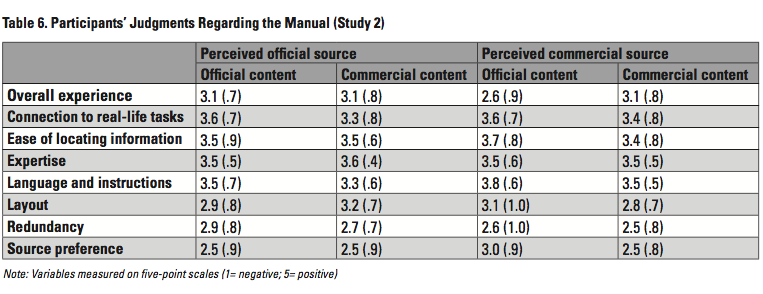
The scores on the seven remaining evaluation constructs were tested using a multivariate analysis of variance. The multivariate test results indicate a significant effect of manual content (Wilks’ lambda = .83, F(7,73) = 2.15, p < .05, partial η² = .١٧). However, the univariate tests did not result in any significant difference between the two manual versions regarding the seven evaluation constructs. In the multivariate test, no significant effect for perceived source (Wilks’ lambda = .94, F(7,59) = .72, p = .66) was found and no interaction effect was found (Wilks’ lambda = .91, F(7,59) = 1.00, p = .44).
Conclusions
The results of the second study partially confirm that the image of commercial manuals is better than that of official manuals. We did not find significant differences regarding participants’ judgments of the manual versions. Both manual content and perceived source did not appear to matter. However, we found significant differences in the participants’ performance: Participants performed significantly better, in terms of effectiveness and efficiency, when they believed the manual they used was a commercial manual.
Discussion
Main findings
The two studies described in this article show that there may be image differences between official and commercial manuals. The first study showed that these image differences manifest themselves in users’ expectations. Participants had significantly more positive expectations about several aspects of the commercial manuals. For one, they expected a better connection between the manual and real-life tasks. On the spectrum between a system orientation and a user orientation, they expected the commercial manual to be closer to the user. This is plausible, as the writers of commercial manuals can be seen as outsiders and expert users, instead of representatives of the company responsible for the software. This connects to the “sense of otherness,” which Coney and Chatfield (1996) distinguish in commercial manuals, and which may be cultivated by a strong authorial voice in commercial instructions.
Participants also had more positive expectations about the language and instructions and the layout of the commercial manual. They expected the commercial manual to be more effective in providing instructions and to have a more inviting and user-friendly layout. This may be related to the fact that commercial writers are credited with authorship and may be expected to have a good reputation, whereas the writing team of official manuals remain anonymous. It may also have to do with assumptions about the importance attached to the quality of manuals in the two contexts, as distinguished by Carliner’s (2012) business models. Commercial manuals are perceived as core products of the publishers, whereas official manuals may primarily be seen as supporting products for the software company.
Finally, participants would consider the commercial manual to be a more serious competitor to other sources of information than the official manual. This difference does not focus on specific aspects of the manuals but is related to behavioral decisions about using or not using the manual. It may have to do with quality expectations, but our regression analysis showed that participants’ expectations regarding the other six constructs did not have any predictive value for their source preference score. It may therefore relate to a less rational inclination to prefer paid advice. A possible explanation for this finding may be found in a more general psychological mechanism, according to which people may be more inclined to use paid-for support than free support. Gino (2008) described this mechanism, which she called the “paid-advice effect,” in a series of experiments. Participants could earn money by answering questions but were sometimes offered (either voluntary or obligatory) free or paid advice. Even though they were informed that the advice was a random selection of possible recommendations, they consistently used paid advice more often than free advice. Such behavior may be fueled by a desire to optimally benefit from invested money (this explanation would not be valid in our research, as the participants did not pay for either manual version) but may also be a general notion that paid advice must be better than free advice.
Study 2 showed that the image of the manual remains relevant when people are actually working with the instructions. Participants performed significantly better when they thought their instructions were based on the commercial manual. This is remarkable, as the content of the official manual in fact proved to be more effective for this particular set of assignments. Of course, the positive score of the content of the official manual should be treated with caution. The research was primarily designed to focus on image, not on content quality. The manual versions were only small excerpts from both manuals; we cannot say anything about their representativeness for the entire manuals, and the tasks the participants had to do were only two of a multitude of possible tasks. However, the discrepancy between the positive effects of a commercial source and the lower effectiveness of the commercial content, within the boundaries of this experiment, provides a clear indication of the image problem of official manuals and the favorable image of commercial manuals. This is the type of image that may become a self-fulfilling prophecy: The mere source effect of a commercial manual leads to more effectiveness in user performance, which in turn may contribute to its positive image.
The fact that we did not find any significant differences in the second study regarding participants’ judgments is remarkable. The clear image differences that emerged from the first study disappear when participants are actively working with the manual. The significant effects that manual version had on actual performance was not reflected in the participants’ judgments. The phenomenon that experimental research with manuals does result in significant differences in performance but fails to show significant differences in self-report measures, however, is not new. In their research into the effects of motivational elements in user instructions, Loorbach, Karreman, and Steehouder (2007, 2013) also found results combining significant effects on task performance and no effects on the self-reported variables. The same phenomenon can also be found in De Jong’s (1998) research into the effects of pretesting and revising brochures: The revised versions appeared to be better in terms of comprehensibility or persuasiveness but did not show significant improvements in overall appreciation. An explanation for this lack of significant differences may lie in participants’ cognitive workload: When concentrating on performing tasks and/or processing information, it may be too much for participants to also focus on a detailed evaluation of the document they use.
Limitations and future research
Of course, it should be noted that our findings regarding users’ expectations and experiences are based on single experiments, with one particular software package, and one representative of the available gamut of commercial user guides. Future research could verify whether the effects found in our studies are generalizable to official and commercial software manuals in general.
In the first study, we could not convincingly connect the image findings to participants’ intentions to use the manual. Future research that further explores the connection between image differences and use intentions would be interesting. Such research could also take the reverse route by offering participants the choice between an official and a commercial manual, and asking for a preference and motivations.
In the second study, only two specific tasks were selected, corresponding to 12–15 pages in the manuals. Our findings regarding the effects of perceived source may be expected to be robust, as these effects do not depend on the characteristics of the specific content used. Our findings regarding the effects of manual content, however, cannot be seen as generalizable, because the set of tasks and the selection of manual texts may not be representative. These findings merely served as reference point, indicating that the official manual content, at the very least, was not worse than the commercial content.
Future research may also aim to shed light on the underlying mechanism of the differences found in our study. Is the paying an important factor? Or the authorship? Or the publisher or book series? Or a general sense of quality assurance? Experiments that systematically manipulate different versions of official and commercial manuals may help to further explore such factors.
Practical implications
A limitation to the practical implications of our study is that official manuals will always be official manuals, and, for that matter, commercial manuals will always be commercial manuals. However, our overall finding that image matters, not only for the intention to actually use a manual but also for its effectiveness in use, may inspire manufacturers of products to start paying attention to the image aspects of manuals. It seems to be interesting to explore ways of improving the image of particular manuals, for instance by using quality marks or making usable documentation one of the explicit assets of a product. This connects to earlier discussions in the technical communication literature regarding the value added by technical documentation (Mead, 1998; Redish, 1995). Two prominent ways of reaching added value are enhancing the user experience and reducing costs. Image may affect both and is to date an underused phenomenon.
Conclusion
In sum, our research shows that the source of a manual (official versus commercial) matters for users. In our first study, we showed that the source affects users’ expectations of a manual. Their expectations of commercial manuals are significantly more positive in several respects. In our second study, we showed that the source also affects users’ task performance. Users are more effective when they think they work with a commercial manual. More research is needed to further explore these intriguing findings.
References
Aubert, B., Trendel, O., & Ray, D. (2009). The unexpected impact of user manual at the pre-purchase stage on product evaluation and purchase intention: An exploratory study. Advances in Consumer Research, 36, 944–946.
Carliner, S. (2012). Using business models to describe technical communication groups. Technical Communication, 59, 124–147.
Celuch, K. G., Lust, J. A., & Showers, L. S. (1992). Product owner manuals: An exploratory study of nonreaders versus readers. Journal of Applied Social Psychology, 22, 492–507.
Coney, M. B., & Chatfield, C. S. (1996). Rethinking the author-reader relationship in computer documentation. ACM SIGDOC Asterisk Journal of Computer Documentation, 20(2), 23–29.
De Jong, M. D. T. (1998), Reader feedback in text design. Validity of the plus-minus method for the pretesting of public information brochures. Dissertation University of Twente. Amsterdam, The Netherlands: Rodopi.
Frith, J. (2014). Forum moderation as technical communication: The social Web and employment opportunities for technical communicators. Technical Communication, 61, 173–184.
Gino, F. (2008). Do we listen to advice just because we paid for it? The impact of advice cost on its use. Organizational Behavior and Human Decision Processes, 107, 234–245.
Hsieh, M.-H., Pan, S.-L., & Setiono, R. (2004). Product-, corporate-, and country-image dimensions and purchase behavior: A multicountry analysis. Journal of the Academy of Marketing Science, 32, 251–270.
Jansen, C., & Balijon, S. (2002). How do people use instruction guides? Document Design, 3, 195–204.
Johnston, A., & Warkentin, M. (2010). The influence of perceived source credibility on end user attitudes and intentions to comply with recommended IT actions. Journal of Organizational and End User Computing, 22(3), 1–21.
Knobloch-Westerwick, S., Mothes, C., Johnson, B. K., Westerwick, A., & Donsbach, W. (2015). Political online information searching in Germany and the United States: Confirmation bias, source credibility, and attitude impacts. Journal of Communication, 65, 489–511.
Loorbach, N., Karreman, J., & Steehouder, M. (2007). Adding motivational elements to an instruction manual for seniors: Effects on usability and motivation. Technical Communication, 54, 343–358.
Loorbach, N., Karreman, J., & Steehouder, M. (2013). Verification steps and personal stories in an instruction manual for seniors: Effects on confidence, motivation, and usability. IEEE Transactions on Professional Communication, 56, 294–312.
Lust, J. A., Showers, L. S., & Celuch, K. G. (1992). The use of product owner manuals: A comparison of older versus younger consumers. Journal of Business and Psychology, 6, 443–463.
Mayer, R. C., Davis, J. H., & Schoorman, F. D. (1995). An integrative model of organization trust. Academy of Management Review, 20, 709–734.
Mead, J. (1998). Measuring the value added by technical documentation: A review of research and practice. Technical Communication, 45, 353–379.
Pedraz-Delhaes, A., Aljukhadar, M., & Sénécal, S. (2010). The effects of document language quality on consumer perceptions and intentions. Canadian Journal of Administrative Sciences, 27, 363–375.
Poiesz, T. B. C. (1989). The image concept: Its place in consumer psychology. Journal of Economic Psychology, 10, 457–472.
Pornpitakpan, C. (2004). The persuasiveness of source credibility: A critical review of five decades’ evidence. Journal of Applied Social Psychology, 34, 243–281.
Redish, J. (1995). Adding value as a professional technical communicator. Technical Communication, 42, 26–39.
Rettig, M. (1991). Nobody reads documentation. Communications of the ACM, 34(7), 19–24.
Schriver, K. A. (1997). Dynamics in document design: Creating text for readers. New York, NY: John Wiley.
Svenvold, M. (2015). Instructions not included: What the vanishing manual says about us. The disappearance of the instruction manual. Popular Science. Retrieved from: http://www.popsci.com/instructions-not-included
Swarts, J. (2012). New modes of help: Best practices for instructional video. Technical Communication, 59, 195–206.
Swarts, J. (2015). What user forums teach us about documentation and the value added by technical communicators. Technical Communication, 62, 19–28.
Szlichcinski, K. P. (1979). Telling people how things work. Applied Ergonomics, 10, 2–8.
Ten Hove, P., & Van der Meij, H. (2015). Like it or not. What characterizes YouTube’s more popular instructional videos? Technical Communication, 62, 48–62.
Tsai, W.-C., Rogers, W. A., & Lee, C.-F. (2012). Older adults’ motivations, patterns, and improvised strategies of using product manuals. International Journal of Design, 6(2), 55–65.
Van der Meij, H., Karreman, J., & Steehouder, M. (2009). Three decades of research and professional practice on printed software tutorials for novices. Technical Communication, 56, 256–292.
Van der Meij, H., & Van der Meij, J. (2013). Eight guidelines for the design of instructional videos for software training. Technical Communication, 60, 205–228.
Van Loggem, B. (2013). User documentation: The Cinderella of information systems. In A. Rocha, A. M. Correia, T. Wilson, & K. A. Stroetmann (Eds.), Advances in information systems and technologies (Vol. 206, pp. 167–177). Heidelberg, Germany: Springer.
Van Loggem, B. (2014). ‘Nobody reads the documentation’: True or not? In Proceedings of ISIC: The Information Behaviour Conference, Leeds, 2–5 September, 2014, Part 1. Retrieved from http://www.informationr.net/ir/19-4/isic/isic03.html#.VmAs9k2hdaQ
Wiese, B. S., Sauer, J., & Rüttinger, B. (2004). Consumers’ use of written product information. Ergonomics, 47, 1180–1194.
Winter, S., & Krämer, N. (2014). A question of credibility – Effects of source cues and recommendations on information selection on news sites and blogs. Communications, 39, 435–465.
Wogalter, M. S., Vigilante, W. J., & Baneth, R. C. (1998). Availability of operator manuals for used consumer products. Applied Ergonomics, 29, 193–200.
Wright, P., Creighton, P., & Threlfall, S. M. (1982). Some factors determining when instructions will be read. Ergonomics, 25, 225–237.
About the Authors
Menno D.T. de Jong is a professor of communication science at the University of Twente (Enschede, The Netherlands). His research interests are in the fields of technical and organizational communication. He is an associate fellow of the STC and edited Technical Communication between 2009 and 2015. Contact: m.d.t.dejong@utwente.nl.
Bingying Yang holds a double master’s degree of technical communication and computer-aided translation from the University of Twente (Enschede, The Netherlands) and Peking University (China). She currently works in the IT graduate program of Shell. Contact: icicleyang@gmail.com.
Joyce Karreman is an assistant professor of communication science at the University of Twente (Enschede, The Netherlands). Her research interests include the design, the use, and the evaluation of instructive documents. She teaches courses in technical writing and user support. Contact: j.karreman@utwente.nl
Manuscript received 30 March 2016, revised 13 June 2016; accepted 30 June 2016.