doi.org/10.55177/tc344445
Abstract
Purpose: The goal of this article is to provide a tutorial for measuring the sustainability impacts of our content. Sustainability considerations should be just as important as the accessibility and usability of content. Fortunately, following our known best practices for effective content creation and governance also results in a smaller carbon footprint. This not only benefits the planet but also positions content creators as valuable business assets.
Method: An extensive literature review led to the development of processes and guidelines that connect our existing best practices for content with a new paradigm for sustainable content.
Results: This tutorial will examine five content scenarios and the relative impacts of each: modifications to individual web pages, content governance (removal of redundant, outdated, and trivial content), email blasts, videos, and podcasts. Metrics will be provided for justifying content decisions to management, and recommendations will be given for both optimizing usability and sustainability.
Conclusion: Merging established best practices for content creation and curation with measurable energy-to-emissions data gives us powerful tools for justifying content choices and demonstrating measurable value to both the organization and the planet.
Keywords: Sustainability, Best Practices, Business Value, Digital Content
Practitioner’s Takeaway
Digital content—the bits and bytes that form our websites, apps, videos, and podcasts—is nothing more than energy. Energy has a carbon cost. Therefore, there must be a direct and measurable correlation between content and greenhouse gas emissions. By following all-inclusive guidelines and best practices for sustainable content, practitioners will be able to:
- Identify a direct correlation to the organization’s sustainability initiatives
- Demonstrate that existing content best practices and sustainable content go hand-in-hand
- Calculate the economic and environmental benefits of content improvements
According to the International Panel on Climate Change (IPCC), human-induced warming of the climate system is widespread (Hegerl et al., 2007). The impacts of climate change will be far-reaching and dramatic, with unevenly distributed effects that disproportionately impact women (United Nations Women Watch, 2009; van Daalen et al., 2020), BIPOC communities (EPA Press Office, 2021), and those living in poverty (The Organization for Economic Cooperation and Development, 2003; Yabe & Ukkusuri, 2020). “Unabated climate change will have dramatic effects on inequality, poverty, and economic opportunity. At the same time, poverty and inequality contribute to climate change” (Colmer, 2021).
Climate is inextricably intertwined with equity, education, health, and justice. This is why the United Nations released the 17 Sustainable Development Goals (SDGs) in 2015. They provide “a shared blueprint for peace and prosperity for people and the planet, now and into the future.” (United Nations, 2022). The SDGs are an acknowledgement that none of the challenges facing humanity can be studied or solved in isolation; we must take an interdisciplinary approach that recognizes the connections between poverty, education, inequality, and climate.
We are on a path for planetary warming of 2.0°C and beyond. The 2022 IPCC Summary for Policymakers notes that “near-term actions that limit global warming to close to 1.5°C would substantially reduce projected losses and damages related to climate change in human systems and ecosystems” (IPCC, 2022). With that in mind, we all have an obligation to mitigate our climate impacts where we can.
This Isn’t Personal
We have been told that we must make changes to our personal lives to influence the course of climate change. While there are certainly many options for change on a personal level—household solar arrays, electric vehicles, vegan lifestyles, and abandoning air travel, to name a few—no individual lifestyles changes have as much impact as those we make at work.
According to a 2017 report published by the Carbon Disclosure Project (CDP), the not-for-profit organization that runs the global disclosure system, 100 companies are responsible for more than half of all greenhouse gas emissions since the start of the industrial revolution 250 years ago. These organizations are responsible for 71% of all emissions since 1998 (CDP, 2017).
If the majority of emissions are driven by corporations, then how can we leverage our professional impact? How could we, as content professionals, make a difference? Certainly, there are opportunities for climate reporting, or emphasizing sustainability attributes of our products and services, but what about the content itself?
I discovered that we can make direct connections between the content we create and the greenhouse gas emissions associated with that content.
Establishing a Baseline: Understanding Carbon Footprints
Where does energy come from, and how does that create emissions?
Currently, 20% of energy in the U.S. comes from renewable sources, such as solar, wind, geothermal, or hydroelectric. The majority comes come from the burning of fossil fuels, such as petroleum, natural gas, or coal (Frequently Asked Questions (FAQs) – U.S. Energy Information Administration (EIA), n.d.). When fossil fuels are burned, they release carbon dioxide into the atmosphere. Carbon dioxide is a greenhouse gas that traps heat in the atmosphere, causing the planet to warm. While some carbon dioxide exists naturally in the atmosphere, the levels of atmospheric carbon have been increasing steadily since the start of the industrial revolution (U.S. Department of Commerce, n.d.).
There is a direct correlation between energy and data. According to a report published by the nonprofit research organization the American Council for an Energy-Efficient Economy (ACEEE), each gigabyte (GB) of data requires 5.12 kWh of energy (Costenaro & Duer, 2012). This is a very abstract number for most people, but this means that according to the Greenhouse Gas Equivalencies calculator from the U.S. Environmental Protection Agency (EPA), data is responsible for approximately five pounds of greenhouse gas emissions for every gigabyte of data (Greenhouse Gas Equivalencies Calculator | US EPA, 2022).
Note that this calculator is regularly updated to reflect the current emissions per kWh in the United States. While the world is moving away from reliance on fossil fuels, progress is slow. According to the latest data from the U.S. Energy Information Administration, in 2021 the United States generated approximately 20% of its energy from renewable sources (U.S. Energy Information Administration, 2021). Even if we increase our renewable energy production by 10% annually, we’ll still be relying on fossil fuels for about half of our energy in 2030.
For decades we have heard about our carbon footprint—the impact that our lives and choices have on the Earth’s climate. Many of us have considered or made choices that have influenced our personal footprints but have rarely considered the impact that we could have at the organizational level. The next section will quantify the scope of some of those personal impacts, so we have context for what we’ll talk about later.
Why do we know about climate footprints?
While it was a term developed by scientists, it became famous after a BP marketing campaign that began about 20 years ago and is still used today. BP—the corporation formerly known as British Petroleum—wanted to shift the emphasis to personal responsibility to draw attention away from the fact that BP is the fifth largest polluter in history (CDP, 2017). It was a remarkably effective campaign and shifted the conversation to placing the weight entirely on the shoulders of the individual.
Context: Impacts of Personal Choices
Solar
Adding household solar is one of the most significant things that an individual can do to reduce their carbon footprint. At my home in sunny Phoenix, my solar array has generated more than 28,093 kWh of energy in its first year, which according to the EPA calculator is a total of 21.9 tons of greenhouse gas emissions avoided. However, this is an option that is not open to the 36% of Americans who rent their homes (Desilver, 2021), or the 53% of owner-occupied households governed by homeowners association (HOA) restrictions (Homeowner Association USA, 2022).
Electric Vehicles
Replacing a car with an internal combustion engine with an electric vehicle (EV) can eliminate 5.1 tons of emissions per year (US EPA, 2016). But that is an option that assumes a single-family home with a garage; viability of EVs can be limited if you have nowhere to charge overnight.
Dietary Changes
We can go vegan. This turns out to be a smaller impact than you would think (Rosi, 2017). Most early studies assumed that vegans would eat plant-based, locally grown diets. In practice, they eat meat substitutes, nut milks, tofu, and even Oreos. All those foods are highly processed and contribute to your carbon footprint.
Travel
What if we never fly again? I hate to think about it, but it has an impact. In the pre-pandemic times, I would travel to Europe every year to visit my clients. Eliminating that annual trip adds up to a greater greenhouse gas savings than diet does (International Civil Aviation Organization, 2016).
Putting all of this together, solar, EVs, dietary habits, and restricted travel can help you avoid add up to 23 tons of annual greenhouse gas emissions—equivalent to removing 4.5 cars from the road each year.
The Connection Between Data and Carbon Emissions
With the knowledge that the majority of carbon emissions come from corporations, not individuals (CDP, 2017), and that the effects of climate change are unevenly distributed, affecting the most vulnerable populations (Colmer, 2021), then we have an obligation to act accordingly.
Many of us were raised with the promise of digital. Paperless offices, websites, apps, e-books, and emails were heralded as the clean, efficient method of communication. Digital is free. It is harmless.
Not exactly. “Digital is physical,” says Gerry McGovern in his book, World Wide Waste (McGovern, 2020). Digital communications have a huge climate impact. Every bit and byte that we create is nothing more than energy. Energy is quantifiable. And for the foreseeable future, the use of energy emits greenhouse gases. It is therefore our ethical obligation to consider the environmental impact of the content that we create.
In this weird, transformative pandemic era that we are living through, organizations are under increased pressure to measure and report sustainability criteria. It’s not due to altruism; institutional investors see sustainability as a measure of long-term investment risk. These risks can include:
- Limited natural resource availability
- Blackouts or brownouts due to overwhelmed public electrical grids
- A workforce that is poorly educated, unhealthy, or otherwise unable to work
- The direct measurement of carbon emissions
Management is now looking at sustainability not as a niche market, but as a key element of long-term success metrics. The U.S. Securities and Exchange Commission announced plans to update reporting rules to include more environmental, social, and governance (ESG) criteria in corporate reporting (U.S. Securities and Exchange Commission, 2022). Content plays a role in the success of your organization, whether by telling the ESG stories or contributing to the metrics behind the organization’s climate footprint.
Looking at the Numbers
Studies estimate that we use 5.12 kWh of energy per GB of data (Costenaro & Duer, 2012). This means that for every GB of data, we’re emitting 5 pounds of greenhouse gases (US EPA, 2022).
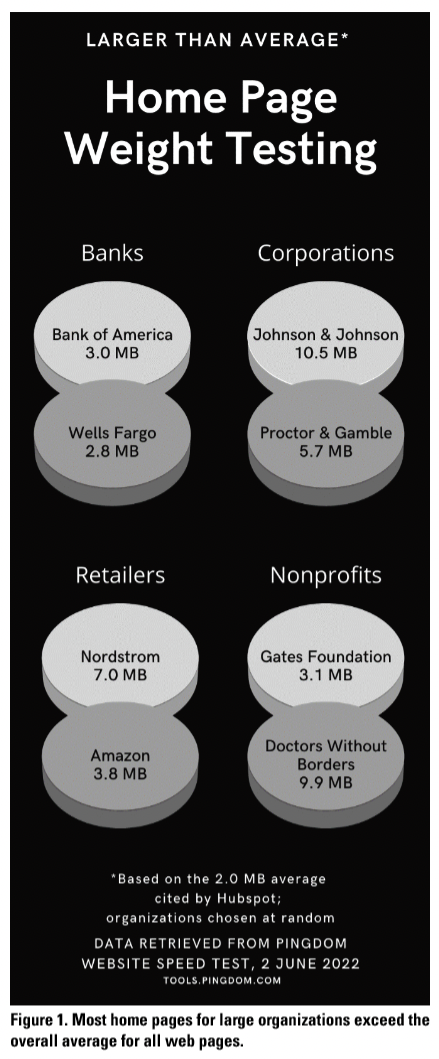
Inbound marketing company Hubspot reports that the average home page weight was close to 2.0 MB in 2020 (Stec, 2020). Some web pages are more than 7 MB per page (Helvetica, 2020). In the process of research for this tutorial, I took a random sampling of banks, corporations, retailers, and nonprofits—literally the first eight that came to mind—and ran them through the Pingdom calculator that measures page weight, load times, and performance (Solarwinds Pingdom, 2021). All of the home page weights were significantly greater than the 2.0 MB average reported by Hubspot.
Why so large? Because the current standard for modern web pages involves large hero images, videos, or carousels that largely fill the screen. As Greenwood and As Greenwood (2021) notes in his book, Sustainable Web Design, roughly half of the weight of a modern web page is imagery. Worse, that imagery tends to be stock art that does not add value to the user’s experience.
Yet this practice goes against the concept of plain language, as advocated by Balmford. He asserts that “plain language” is not wholly accurate. It’s not simply about the choice of words and sentences, but rather the whole document, including language, structure, and design (Balmford, 1998, 1999).
While some argue that plain language “dumbs down” the message, it improves readability. In her book, Content Design, Richards (2017) asserts that, “It’s not dumbing down. It is opening up.”
There are lots of definitions for plain language, but there are common threads:
- It represents the needs of the reader
- It supports comprehension
- It typically uses fewer words
- It improves accessibility
- It makes translation easier
“The benefits of plain language are inarguable…. A commitment to clarity achieves democracy, equity, authenticity, and transparency. It saves time and money, and generates goodwill and compliance” (Petelin, 2010). And, as it happens, plain language also reduces emissions.
Connecting Best Practices to Sustainable Content
As communicators, we know that less can be more. Too much information adversely affects readability, usability, and comprehension. This flood of information also increases data, energy use, and emissions. We’ll look at six examples of how we can do more with less.
The Benefit of Reducing Page Weight
When we look at the weight of a specific web page—such as the Doctors Without Borders web page from Figure 1—we are not looking at the size of the page in isolation. The data contained within their 9.9 MB web page had 225,000 hits in June 2022, according to data provided by SimilarWeb.com. To measure the impact of this web page, we need to multiply the 9.9 MB by the number of times that data was transferred. As we have already established, data is energy, and energy creates emissions. Reducing the page weight would reduce the organization’s carbon footprint.
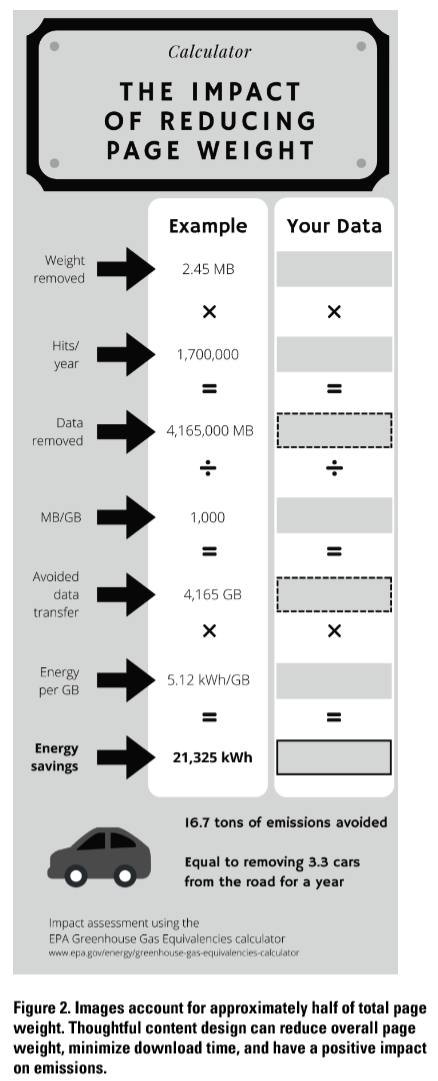
At Company A, they had an image-intensive home page. At 4.9 MB it was heavier than the average weight reported by Hubspot, within the upper half of the examples shown in Figure 1. The page was loaded with stock art of healthcare providers in scrubs and masks; none of these images showed products or services in action, leaving the reader with no visual clues beyond the knowledge that the product was something medically focused.
 Eliminating unnecessary stock images and replacing others with more informative product-oriented photos cut the page weight by half. The end result was a page that still looked like a typical website, but was more informative, downloaded faster, and reduced the carbon emissions by half.
As seen in Figure 2, the net result was a savings of nearly 17 tons of avoided emissions, or the equivalent of removing more than three passenger cars from the road for a year.
The Impact of Adding New Pages
Because content professionals are most often measured by what we create, rather than what we remove or streamline, we need to examine the impact of new pages.
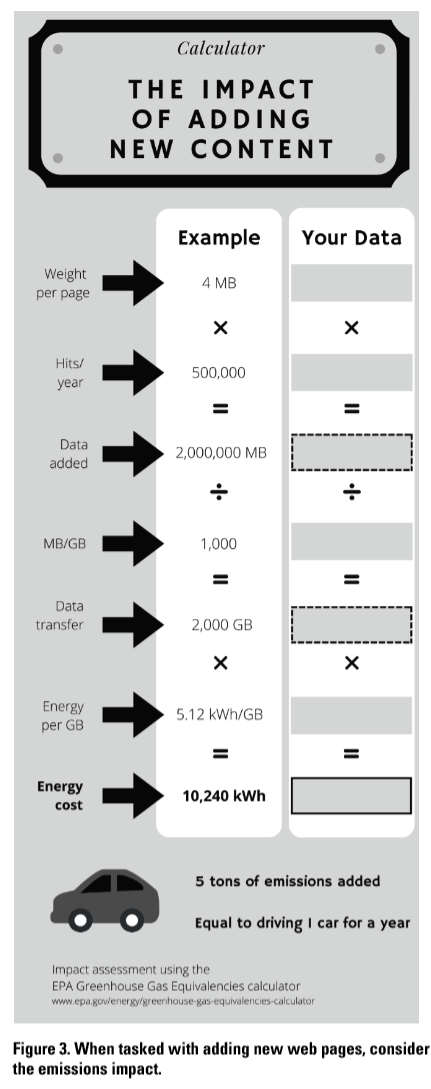
A new product has been released, and management wants to add a new landing page complete with user guides, video tutorials, and other information that helps the customer to get started. We’re going to be charitable and assume that the page is 4 MB, about one-third larger than the Hubspot average. (Note that with the addition of video or photo walk-throughs, it could be significantly heavier.)
The goal is that all new customers will go to this page for information. Management is hoping for 500,000 hits in the next 12 months.
Downloading 4 MB 500,000 times is more than 10,000 kWh of energy, equal to 5 tons of emissions or adding one passenger car to the road for a year.
The Cost of Email Campaigns and Newsletters
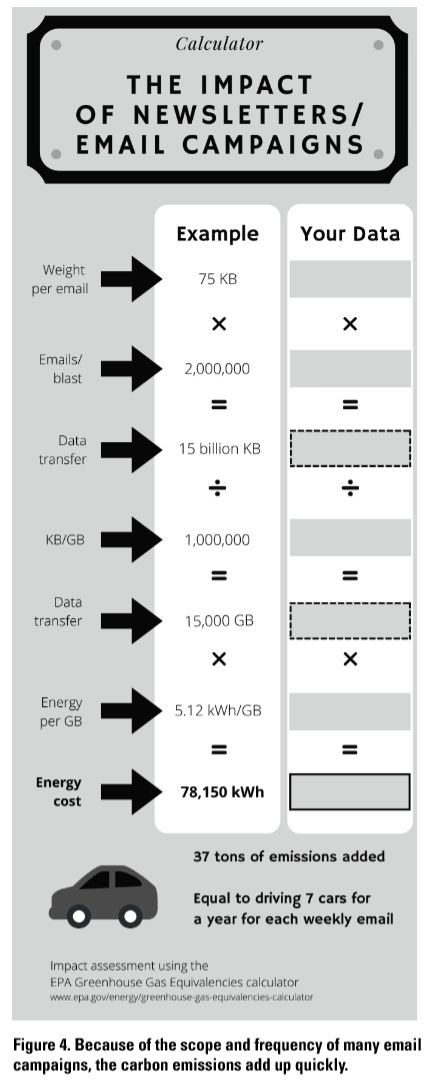
The average email is about 75 KB (Tschabitscher, 2021). This is the average for all emails, from text-only interactions to corporate newsletters. It also only counts the code of the email itself, not the linked images that download after the fact. However, the size, weight, and impact of images varies considerably from one newsletter to the next.
One streaming video service has more than 200 million subscribers who get weekly newsletters by default. We will use the 75 KB average for calculations, even though the additional imagery would add to the total weight.
With 200 million emails sent at a weight of 75 KB each, the total amount of data transferred is 15,000 GB. At an energy cost of 5.12 kWh/GB, that works out to the emissions equivalent of driving a little more than 7 cars for a year. But these emails come weekly, so the annual impact over 52 weeks is closer to 360 cars driven for a year.
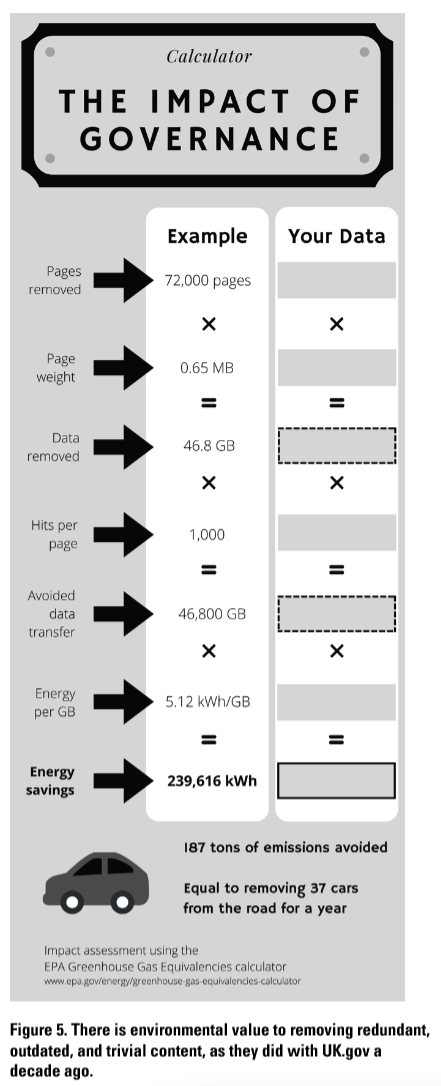
Governance: Removing the Unnecessary
Governance is one of the most overlooked best practices in content. Beyond the benefits for content strategy, it also can have a tremendous impact on an organization’s carbon footprint.
One of the favorite stories in content strategy is the tale of how the U.K. Government Digital Service took 75,000 pages down to 3,000 about a decade ago (Richards, 2020). Web pages were significantly lighter then—research shows that the median page weight was about 650 KB in 2012 compared with about 2 MB per page that’s the reported median for today (Helvetica, 2020). However, as we’ve seen in Figure 1, that “average” data is median for all websites, and there’s reason to believe that government or corporate pages were heavier than average then as they are today.
We can very conservatively assume 1,000 hits per page per year, on average, or 83 hits per page per month. While some pages may have languished untouched, others were so poorly structured or redundant that a visitor might need to view two, three, or five pages to find what they’re looking for.
Removing 72,000 pages was the equivalent of removing 37 cars from the road each year for the past decade. The decision to consolidate and remove not only had usability benefits, but environmental benefits as well.
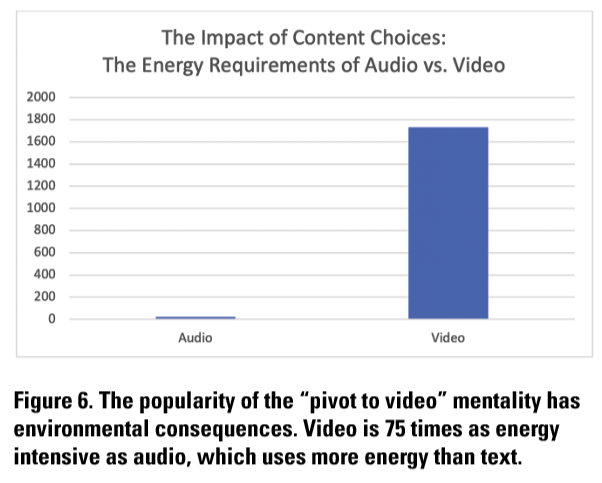
The Relative Impacts of Video vs. Audio: File Size Matters
There are times when video is an indispensable tool for walking customers through setup, use, or maintenance of a product or service. There are also times where video used for the sake of video, as we saw in the “pivot to video” trend that was driven by Facebook half a decade ago (Owen, 2021). In the latter, it is an unnecessary, heavy-weight, flashy example of something that could have been explained just as clearly in text or imagery.
The ways in which video can be used are diverse, which makes comparative weighting difficult. Instead, let us compare audio-only podcasting vs. video podcasting or recorded presentations: informational tools, but not directly tied to product usability.
A half-hour video recording, complete with slides and talking head recorded at YouTube quality of 24 frames per second will end up being about 1.73 GB (Forret, 2022).
Podcast hosting company Blubrry estimates that the same information presented as a half-hour long, mono-channel, talk-only audio podcast-style recording averages about 23 MB (Blubrry, 2021).
When deciding between audio and video, it’s important to decide whether video is worth 75 times the energy and correlated emissions. Always consider video projects on a case-by-case basis.
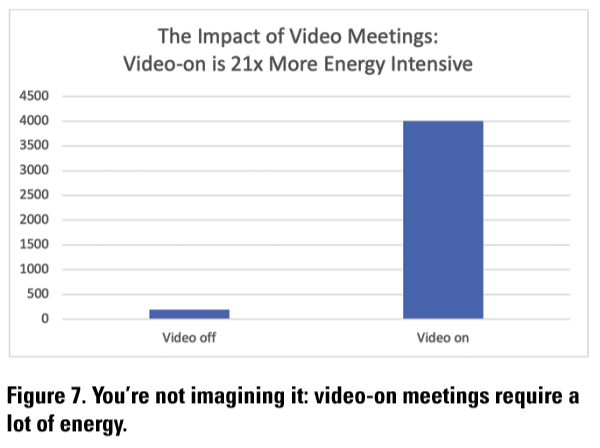
Mitigating the Impact of Video Meetings
In the pandemic era, we all spend a significant portion of our day on video conferences. But that, of course, uses bandwidth, which is energy, which we now know has a carbon cost.
When everyone joins the meeting with video on, the meeting requires roughly 800-900 MB of bandwidth per person (Holslin, 2021). In the past month, I kept track of my meetings. On average, every Zoom meeting had five participants. When everyone has their video on, that works out to an average of 4 GB of data per call.
That same call—the usual screen sharing, the speaker visible in thumbnail, but other participants in video-off mode—works out to be about 190 MB total on a five-participant call. Leaving everyone’s video on for the duration is 20x as energy and emissions intensive as video-off.
Many employers believe that video-on is crucial for building relationships while working remotely. A good compromise can be to have video on for the five minutes of meet-and-greet at the start of the meeting, but video off during screen sharing.
Other Considerations
For this tutorial, we have focused exclusively on the energy required for energy transfer. We have not addressed the ancillary energy costs or environmental impacts associated with the creation or use of the digital information itself.
Without question, there is a significant environmental footprint associated with the manufacture, transport, and operation of any electronic device, including:
- Impacts from mining rare earth minerals
- Waste and pollution associated with the manufacture of semiconductors and other electronic components
- Emissions from the transport of devices
- Energy required for use of the device, even in standby mode
- The waste associated with the disposal of any electronic device
The energy draw of any device varies based on several factors, including the type of device; the age and efficiency of the device; the ancillary devices used with the device, such as computer monitors, Bluetooth keyboards, or wireless headsets; the age and efficiency of the modem; and whether the device is on a wired or wireless connection. We also know from experience that data-intensive activities drain our device batteries more quickly. All this energy has an environmental impact.
We can reduce our footprint with the following actions:
- Replacing our devices less frequently to reduce consumption of resources
- Closing open tabs, which continue to stream data even when idle (Costenaro & Duer, 2012)
- Limiting unnecessary data transfer by limiting the number of people copied on an email with a large attachment (Costenaro & Duer, 2012)
- Sending fewer “unnecessary” emails; a 2019 study showed that 64 million “thank you” or “have a good weekend” emails were sent daily in the U.K., accounting for nearly 26,000 tons of emissions per year (Shrestha, 2019)
- Adjusting your settings so your computer “sleeps” when not in use
- Turning your computer off (not simply asleep, but shut down) at night
- Storing data locally vs. in the cloud; cloud storage is roughly a million times more energy intensive than local storage (Adamson, 2017)
- Reducing the use of Wi-Fi when a wired connection is available
Calculators do exist to measure cradle-to-grave carbon footprints of our electronic devices (Quintana-Pedraza et al., 2019). If you would like to learn more about measuring these impacts, the Quintana-Pedraza et al. article is a good place to start.
Conclusion
Our work has a direct and quantifiable impact, not just on our users, but also on the planet. Communicators who know how to measure the impact of content are positioned to advance their careers, emerging as strategic leaders in the organization.
By measuring the impact of both what you create and what you remove, you are no longer solely looking at page weight from a usability or accessibility perspective—which it absolutely is—but making tangible connections between these content best practices and sustainability.
- Plain language? Fewer words and clearer content not only improve comprehension and reduce translation costs, but it also means smaller file sizes and fewer carbon emissions.
- Reduced page weights? Improved download times increase usability while reducing emissions.
- Fewer emails? Trust me, customers will be happier, and you will also be reducing your carbon footprint.
- Governance? Get rid of the excess and focus on what matters for usability, accuracy, and sustainability.
- And video vs. audio? You finally have a sustainability justification for video-off meetings in a way that positions you as a thought leader.
These are the things that are already within our control. We do not need special permission. We do not need a sustainability-friendly boss, or a company that wants to be a sustainability leader. This is just putting numbers behind what we already do. Following best practices not only benefits our customers and organizations, but also the world that we live in.
References
Adamson, J. (2017, May 1). Carbon and the cloud. Stanford Magazine. https://stanfordmag.org/contents/carbon-and-the-cloud
Alexander, J. (2019, July 26). YouTube videos keep getting longer. The Verge. https://www.theverge.com/2019/7/26/8888003/youtube-video-length-contrapoints-lindsay-ellis-shelby-church-ad-revenue [not referenced in the text; please revise]
Balmford, C. (1998). Getting the structure right: Process, paradigm, and persistence. Clarity, 42, 42–49.
Balmford, C. (1999). Getting the structure right: Process, Paradigm, and persistence (part 2). Clarity, 43, 14–22.
Blubrry. (2021, November 12). MP3 (MPEG layer 3) tips for podcasting. Blubrry Podcasting. https://blubrry.com/manual/creating-podcast-media/audio/mp3-mpeg-layer-3-tips/
Carbon Disclosure Project (CDP). (2017). New report shows just 100 companies are source of over 70% of emissions—CDP. https://www.cdp.net/en/articles/media/new-report-shows-just-100-companies-are-source-of-over-70-of-emissions
Colmer, J. (2021, October 5). How does climate change shape inequality, poverty and economic opportunity? Economics Observatory. https://www.economicsobservatory.com/how-does-climate-change-shape-inequality-poverty-and-economic-opportunity
Costenaro, D., & Duer, A. (2012). The Megawatts behind your megabytes: Going from data-center to desktop. ACEEE Summer Study on Energy Efficiency in Buildings, 13, 65–76.
Desilver, D. (2021, August 2). As national eviction ban expires, a look at who rents and who owns in the U.S. Pew Research Center. https://www.pewresearch.org/fact-tank/2021/08/02/as-national-eviction-ban-expires-a-look-at-who-rents-and-who-owns-in-the-u-s/
Environmental Protection Agency. (2022, March). Greenhouse gas equivalencies calculator. EPA. https://www.epa.gov/energy/greenhouse-gas-equivalencies-calculator
EPA Press Office. (2021, September 2). EPA report shows disproportionate impacts of climate change on socially vulnerable populations in the United States. EPA. https://www.epa.gov/newsreleases/epa-report-shows-disproportionate-impacts-climate-change-socially-vulnerable
Forret, P. (2022). Video filesize calculator · toolstud.io. https://toolstud.io/video/filesize.php
Greenwood, T. (2021). Sustainable Web Design. A Book Apart.
Hegerl, G. C., Zwiers, F. W., Braconnot, P., Gillett, N. P., Luo, Y., Orsini, J. A. M., Nicholls, N., Penner, J. E., Stott, P. A., Allen, M., Ammann, C., Andronova, N., Betts, R. A., Clement, A., Collins, W. D., Crooks, S., Delworth, T. L., Forest, C., Forster, P., … Planton, S. (2007). Understanding and Attributing Climate Change. 84.
Helvetica, H. (2020). The 2020 Web Almanac: Page weight. In The 2020 Web Almanac (Vol. 2, Issue 18). HTTP Archive. https://almanac.httparchive.org/en/2020/page-weight
Holslin, P. (2021, January 11). How to Reduce Zoom Data Usage. SatelliteInternet.Com. https://www.satelliteinternet.com/resources/how-to-reduce-zoom-data-use/
Homeowner Association USA. (2021, October 13). Homeowner associations in the United States: About HOA-USA. HOA. https://hoa-usa.com/about/
International Civil Aviation Organization. (2016). Carbon emissions calculator. ICAO Carbon Emissions Calculator. https://www.icao.int/environmental-protection/Carbonoffset/Pages/default.aspx
IPCC, 2022: Climate Change 2022: Impacts, Adaptation, and Vulnerability. Contribution of Working Group II to the Sixth Assessment Report of the Intergovernmental Panel on Climate Change [H.-O. Pörtner, D.C. Roberts, M. Tignor, E.S. Poloczanska, K. Mintenbeck, A. Alegría, M. Craig, S. Langsdorf, S. Löschke, V. Möller, A. Okem, B. Rama (eds.)]. Cambridge University Press. Cambridge University Press, Cambridge, UK and New York, NY, USA, 3056 pp., doi:10.1017/9781009325844.
McGovern, G. (2020). World Wide Waste: How digital is killing our planet – and what we can do about it (First edition). Silver Beach Publishing.
Owen, L. H. (2021, September 15). Facebook’s pivot to video didn’t just burn publishers. It didn’t even work for Facebook. Nieman Lab. https://www.niemanlab.org/2021/09/well-this-puts-a-nail-in-the-news-video-on-facebook-coffin/
Petelin, R. (2010). Considering plain language: Issues and initiatives. Corporate Communications: An International Journal, 15(2), 205–216. https://doi.org/10.1108/13563281011037964
Quintana-Pedraza, G. A., Vieira-Agudelo, S. C., & Muñoz-Galeano, N. (2019). A Cradle-to-Grave Multi-Pronged Methodology to Obtain the Carbon Footprint of Electro-Intensive Power Electronic Products. Energies, 12(17), 3347. https://doi.org/10.3390/en12173347
Richards, S. (2017). Content Design (First Edition). Content Design London.
Richards, S. (2020). Content Design [Presentation].
Rosi, A. (2017). Environmental impact of omnivorous, ovo-lacto-vegetarian, and vegan diet`. https://doi.org/10.1038/s41598-017-06466-8
Shrestha, P. (2019, November 27). Brits’ ‘thank you’ emails have a massive carbon footprint. Energy Live News. https://www.energylivenews.com/2019/11/27/brits-thank-you-emails-have-a-massive-carbon-footprint/
Solarwinds Pingdom. (2022). Pingdom Tools. Website Speed Test. https://tools.pingdom.com/
Stec, C. (2020). How to Reduce Page Weight on Your Website [Quick Guide]. https://blog.hubspot.com/marketing/reducing-page-size
The Organization for Economic Cooperation and Development. (2003). Poverty and Climate Change Reducing the Vulnerability of the Poor through Adaptation. https://www.oecd.org/env/cc/2502872.pdf
Tschabitscher, H. (2021). Why Are Email Files so Large? Lifewire. https://www.lifewire.com/what-is-the-average-size-of-an-email-message-1171208
United Nations. (2022). The 17 goals | sustainable development. United Nations Department of Economic and Social Affairs | Sustainable Development. https://sdgs.un.org/goals
United Nations Women Watch. (2009). WomenWatch: Women, gender equality and climate change. Women and Climate Change Fact Sheet. https://www.un.org/womenwatch/feature/climate_change/index.html
U.S. Department of Commerce, (n.d.). Global Monitoring Laboratory—Carbon Cycle Greenhouse Gases. https://gml.noaa.gov/ccgg/trends/
U.S. Energy Information Administration. (n.d.). Frequently asked questions (FAQS). Frequently Asked Questions (FAQs) – U.S. Energy Information Administration (EIA). Retrieved May 27, 2022, from https://www.eia.gov/tools/faqs/faq.php
U.S. Energy Information Administration (EIA). (2021, May 14). U.S. Energy Information Administration – EIA – independent statistics and analysis. http://www.eia.gov. https://www.eia.gov/energyexplained/us-energy-facts/
U.S. Environmental Protection Agency . (2016, January 12). Greenhouse Gas Emissions from a Typical Passenger Vehicle [Overviews and Factsheets]. https://www.epa.gov/greenvehicles/greenhouse-gas-emissions-typical-passenger-vehicle [not referenced with (2016) in the text- please revise]
U.S. Securities and Exchange Commission. (2022, March 21). Press Release SEC Proposes Rules to Enhance and Standardize Climate-Related Disclosures for Investors. SEC.gov. https://www.sec.gov/news/press-release/2022-46
van Daalen, K., Jung, L., Dhatt, R., & Phelan, A. L. (2020). Climate change and gender-based health disparities. The Lancet Planetary Health, 4(2), e44–e45. https://doi.org/10.1016/S2542-5196(20)30001-2
Yabe, T., & Ukkusuri, S. V. (2020). Effects of income inequality on evacuation, reentry and segregation after disasters | Elsevier Enhanced Reader. Transportation Research Part D: Transport and Environment, 82. https://doi.org/10.1016/j.trd.2020.102260
Alisa Bonsignore clarifies complex ideas, developing sustainable content strategies for a global clientele. Her experience spans several industries over more than two decades, with particular focus on making the world a better place through sustainability communications aligned with the U.N. Sustainable Development Goals (SDGs). She is an Associate Fellow of the Society for Technical Communication, a Certified Master Gardener specializing in xeriscaping, and frequently speaks at conferences and workshops. She can be reached at author@clarifyingcomplexideas.com.