By Oded Ilan
Predicting the Future
An AI god will emerge by 2042 and write its own bible. Will you worship it? —John Brandon
Historically, predicting the future was a craft that belonged in the realms of magic and religion. Whether you were reading bones or stars, stuck inside a whale, or speaking in tongues, seers and prophets had great power. People live in apprehension of what may be, and who wouldn’t want to know the turn of a business deal, the arrival of fortune, or how attractive their spouse will be?
Over time, science gradually replaced magic. As the credibility of science grew, belief in the supernatural waned and skepticism replaced blind faith in the power of prediction.
But despite what many people believe today, predicting the future isn’t always about magic. Just like science allows us to regrow limbs, fly to the heavens, and read minds, today we can calculate probability and once again predict the future. Probability (or predictive analytics) is the ability to collect enough data to be able to identify behavior patterns and predict future similar patterns.

With a lot of experience, good soothsayers could look at people and “read their minds.” The more people they met, the better they became at it. In just the same way, the more data you have, the more reliable your predictions will be. Mega-corporations like Google and Facebook, which have access to incalculable amounts of user data, have long since taken the lead in predicting user preferences, targeting them with additional content in order to monetize this data.
In this article, we’ll take a look at some of the more accessible ways content and training teams can leverage user behavior analytics for delivering accurate content that will help improve training and onboarding results.
Personalization Is Taking over Digital Interactions
The most common and effective use of user data is for creating personalized content. I’m referring to content in the widest sense of the word: social networks, advertising platforms, micro-learning platforms, e-commerce platforms, and much more.
Social networks are getting better at delivering organic or paid content based on what the reader previously engaged with. If I often “Like” or comment on Walmart’s Facebook page, I’m more likely to respond to their promoted ads. Those patterns will eventually dictate the content that comes in our Facebook, Twitter, and Instagram feeds, allowing these companies to target us with correlating content.
Now let’s put predictive analytics into an even more advanced mode: Let’s say that 73 percent of Walmart’s Facebook page visitors also like to buy at Macy’s; Macy’s could use Facebook’s algorithms to automatically target every new Walmart page viewer, predicting a 73 percent chance that this would be beneficial for them!
The distinction between paid and organic content on social platforms is becoming more and more blurred. What makes that possible is the razor-sharp targeting based on personalized preferences. When we are engaged with what we read, we’re more inclined to become immersed in it and even more enthusiastic about paying to stay at that level of engagement and interest.
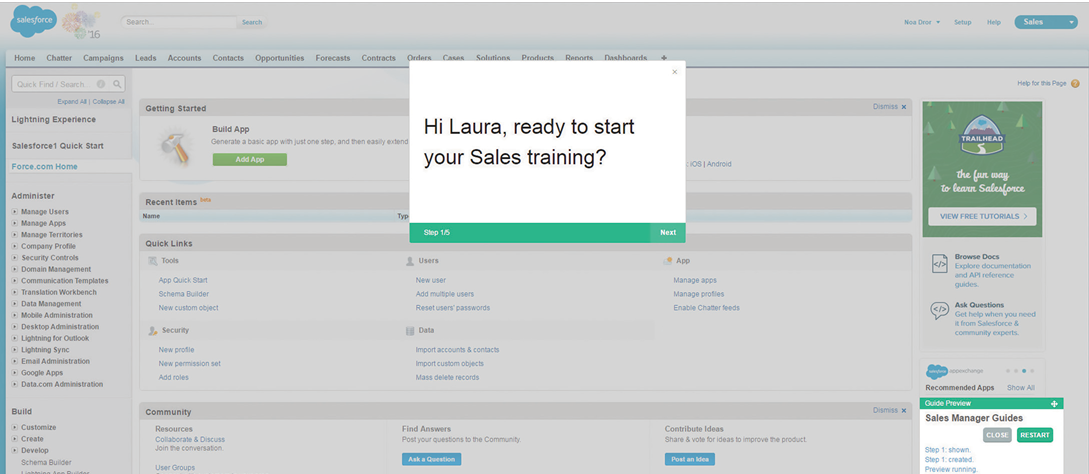
The same goes for micro-learning. By its nature, micro-learning is designed to be bite-sized assistive content (see figure 2). This medium’s purpose is to blend seamlessly into existing products and make learning seem like an organic part of the product experience. In micro-learning, words are chosen carefully, because any wrong turn may result in the user losing patience and wandering off the page. Personalized content can turn an otherwise average learning experience into a stellar training session that wins the user over.
These small bites, viewed by and engaged with by numerous trainees, create a huge amount of data. Countless bits of data can be cross-referenced with other training data and, with additional user information and using analytics, can provide predictive understanding about future training and support needs.
Getting It Just Right: Personalized Training
So how do we go about delivering perfectly tailored content that would guarantee users’ engagement? How do we apply that to training environments?
First, we must start compliling a database of recorded user actions. Each user activity is aggregated and added to the equation. We need to understand which actions were attempted, where users got stuck, and which actions were completed. Once this data is collected, we add to our “magic” cauldron as much user information as we can get our hands on: role, position, history of usage in the product. Even level of technical savviness.
Key points to remember:
- While each user is unique, each is also part of the whole, and the whole is built of countless users.
- While each user is unique, each can also be classified via “types,” “sub-types,” “sub-sub-types,” and so on.
- Predictive analysis is based on understanding what most users of certain types prefer.
- The more data we have (the more people and actions), the better we get at predicting activities and needs.
More powerful software and hardware can contain and manage huge amounts of data, sift through them quickly, and glean meaning from it all. As these systems get more complex—reviewing huge amounts of information from billions of users with hundreds of billions of activities—their ability to second guess your next need/action will come close to perfection.
With all that data at our fingertips, we can easily predict which assistive content would most appeal to the user, what would be just-in-time help, and what they would find most engaging. Once we deliver that content, we can measure the level of engagement and repeat or correct, according to the success stats.
Best Practices for Training Evaluation
Deciding what to do with the data can be quite challenging, but getting your hands on it can also be challenging. There are plenty of tools out there to help you gather information on user behavior. The trick is to know which ones to combine for best results.
To get the right data, we first need to understand what we’re looking for. Identifying user behavior on Web-based products means tracking user actions by pre-set goals and events, for instance, clicking “submit” in certain forms, completing certain fields, and creating certain elements. Goals need to be things an analytics tool can track: buttons, fields, time spent on a page, and elements viewed.
For a visualization of user behavior in your platform, the best option is session recording, like what Hotjar does. You can record and then play and inspect user sessions in your product. This is a terrific way to identify usability issues, figure out which calls to action (CTAs) are less effective and in which workflows users are getting stuck. Hotjar also offers heat-maps, reflecting which areas are clicked more.
Now that We Have the Data, What Can It Tell Us?
Tracking user interaction with those elements can tell you a lot about two things: product limitations and the user’s level of engagement with the product.
Product limitations can be identified only by accumulating enough user data to indicate a pattern. If a critical mass of users are having a hard time completing a certain task, that may mean it’s time to revisit the user experience design. Users don’t always recognize the root of issues they are having, and less tech-savvy users may default to assuming the problem is with their skill rather than the product.
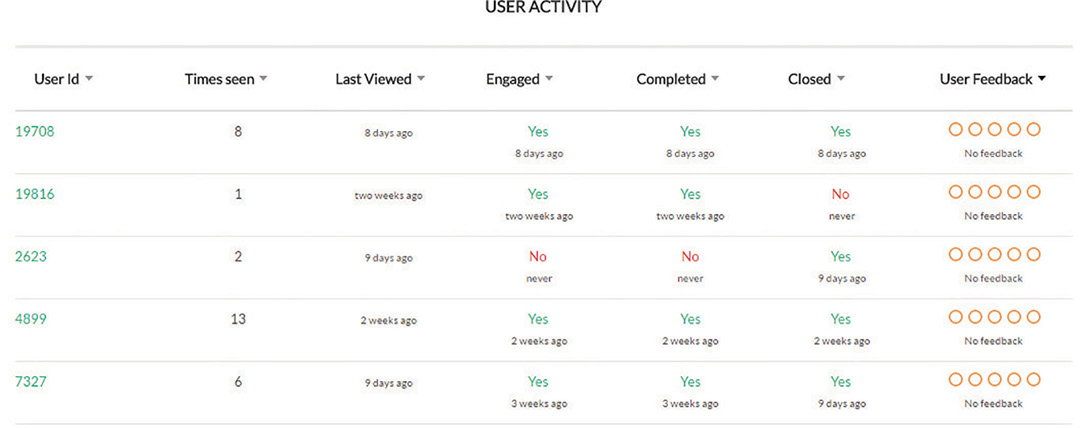
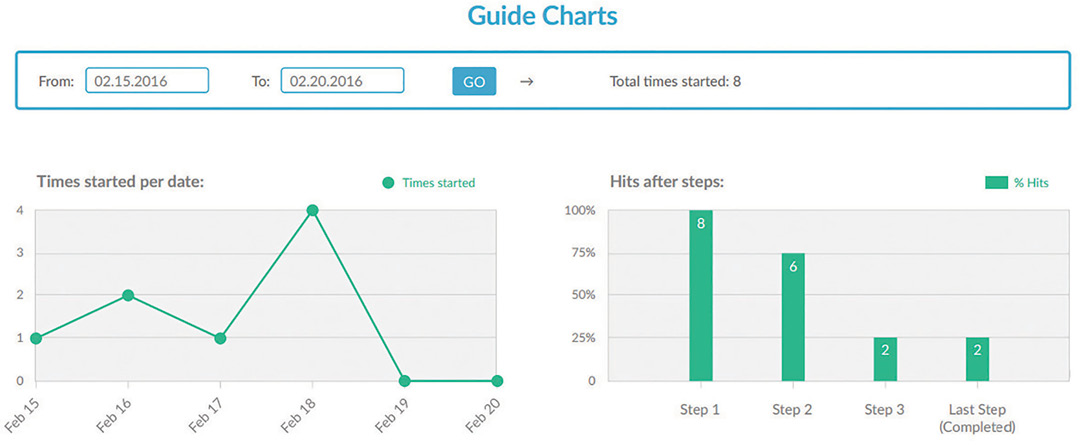
User engagement, on the other hand, is analyzed individually by user. Low user engagement can be the result of the user’s uncertainty as to the technology or lack of proper training. Optimally, your analytics platform would be able to do both: aggregate large amounts of user data and break down individual user activity history. Figure 3 shows an example, from Iridize’s analytics platform, of two separate data sets that complete each other to show the full circle of user behavior data.
In that regard, user analytics can help change and even redefine supportive content, by offering insights into how users are interacting with your product from multiple angles, highlighting the perspective you need.
Summary
Many solutions allow you to monitor user behavior, parse their activities, and analyze them, but real evaluation is to continuously see how customers acted after the training over a span of time, how often they needed additional support, and how quickly they mastered the various tasks.
Predicting user behavior only has meaning if we can deliver the content that improves the user’s experience. Today, we have the tools and capabilities to personalize that content in a way that creates a truly seamless user experience.
What’s next?
- We’ve collected user behavior, parsed it, and combined it with additional information to makes sense of it all.
- We allowed our platforms to review this information and developed algorithms that, based on the rules we generate, will provide users with additional content.
- Now we are ready for the next big leap—letting the system learn user behavior from the analytics and understand that behavior in order to generate new content—and that’s where artificial intelligence steps in.
ODED ILAN (oilan@iridize.com) is the Chief Marketing Manager of Iridize and brings to the company over 20 years of industry experience. Oded oversees all the strategic marketing and sales activities of Iridize, directing the company’s messaging and offering to ensure Iridize makes the most of its potential as a leading product. Oded has a very hands-on approach, often doing simple sales calls with customers to ensure he is very close to the customers and understand their needs. Oded is a well-regarded speaker and thought leader in the field of employee onboarding and training and is often invited to write for publications and speak at prestigious events.