by Saul Carliner | STC Fellow and Yuan Chen

As noted in the guest editorial, whether they work externally or internally, technical communicators have customers. Throughout this issue’s feature articles, customer refers to the organization that pays for the services of technical communicators—and can stop payment on those services. Externally, most people realize that they work for a client or customer, but even those technical communicators who work internally have customers: The group in the organization that can approve the budget for the technical communication—and withhold it.
Technical communicators interact regularly with their customers. Although they might not regularly interact with the executive of the company who hired them or the one who oversees an internal technical communication group, they often interact with an ombudsperson—a leader in the customer group who serves as the go-to person—as well as the many subject matter experts (SMEs) who provide and review technical content.
Given the centrality of customers to our work—the extent of our ongoing interactions with their SMEs and their influence over the funding of the internal and external groups for which we work—exploring customers’ perceptions of technical communicators makes sense. That’s the purpose of this study.
This article explains how the study was conducted and describes the “customers” who participated in it.
How We Conducted This Study
This study explores perceptions of technical communicators held by the people who either pay for their services (for example, vice presidents of product development and directors of marketing) or who work for the people who pay for technical communication services. In this study, these people are called customers of technical communication.
Also, in this study, technical communicators are defined as professionals who perform the following work, as well as those who manage them.
- Identify, design, and develop the instructions for users, service representatives, marketing representatives, and others who use complex software, hardware, and related products
- Prepare reports, proposals, and other materials about scientific and engineering projects
- Edit, illustrate, and translate this content
Specifically, this study explores perceptions of:
- General customer experiences of working with technical communicators
- The specific value that technical communicators offer to customer organizations
- The qualifications customers see as most important for an effective technical communicator
- General customer perceptions of the profession
Recruiting customers for this study was a bit tricky. Because we did not have a direct partner who could provide us with access to the people who serve as our customers, we tried to reach them through technical communicators. Through the STC, we sent recruiting messages to its mailing list, which asked recipients to forward on the invitation to the customers in their organizations. STC also posted the announcement on its website.
Customers who chose to participate in the study participated in an online survey. After clicking on a link in the email invitation or online announcement, participants visited the page for the survey, which presented an Information and Consent Form that explained the survey and asked participants to explicitly agree to continue with the survey.
Those who agreed to continue received a qualifying question to ensure that they were not technical communicators or their managers. Those who indicated that they identify as technical communicators or their managers were thanked for their willingness to participate, sent to a screen outside of the survey, and did not continue.
Those who met the qualifications for the study completed the survey. When participants finished the survey, the system displayed a thank-you message.
The survey took between five and ten minutes to complete.
Before launching the survey, we conducted user tested it to make sure that the instructions and questions were clear. This resulted in a few minor changes in wording to some of the questions at the suggestions of the participants.
Of the 81 people who started the survey, 48 identified as technical communicators and they did not continue the survey. The rest of this special issue reports the results of the 33 responses that we received.
This is admittedly lower than we had hoped, so in the rest of this article, we not only explore the characteristics of the customers who participated but contrast the characteristics of their employers to see how representative it is to the sample in the 2018 Census of Technical Communicators (December 2018 issue of Intercom). If strong similarities exist, then the organizations represented in this survey could be said to have some level of alignment with those for which technical communicators work, as identified in the 2018 census.
The Types of Organizations for Which “Customers” Work
This section describes the organizations for which participants work. As noted earlier, we compared the results of this sample with the results of the 2018 Census of Technical Communicators (December 2018 issue of Intercom) to determine whether the employers for which customers in this study worked seemed representative of the employers identified in the earlier study. If the two aligned, then the results of this study could be said to be reflective of the larger field.
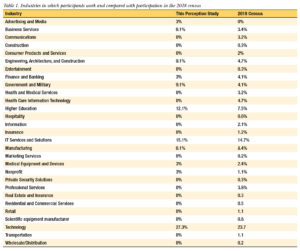
Because of the smaller sample size, participants in this study worked in a smaller number of industries than those who responded to the 2018 Census of Technical Communicators. However, the two largest industries in both surveys are the same—IT services and solutions and technology—and the proportions are somewhat similar in the two studies.
For example, 15.1% of participants in this perception study work in the IT services and solutions industry and while 14.7% of participants in the census did. Similarly, 27.3% of participants in this perception study work in the technology industry and while 23.7% of participants in the census did. Similar alignment exists in other industries. Table 1 identifies the industries in which participants in this perception study work and compares that with the results of the 2018 census.
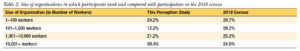
 In terms of the sizes of organizations for which participants work, the largest percentage (39.4%) worked for large organizations with 10,000 or more workers. The second largest percentage of participants (24.2%) work for small organizations with 100 or fewer workers. Although similarities exist between the sizes of organizations represented by the participants in this study and those technical communicators who participated in the 2018 census, participants in this study are more likely to work in large organizations and far less likely to work in organizations with 101 to 1,000 workers than those in the 2018 census. The alignment between the two groups is not as strong as the alignment in industry. Table 2 identifies the sizes of organizations in which participants in this perception study work and compares that with the results of the 2018 census.
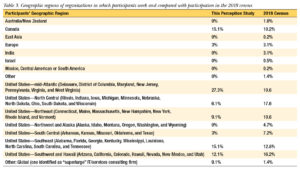
In terms of geographic regions in which participants work, participation outside of the United States was much lower in this perception study than in the 2018 census. For example, the census had participants from East Asia, India, Israel, and South and Central America, but no participants from those regions in this study. Within the United States, no one from the Northwest and Alaska (Alaska, Idaho, Montana, Oregon, Washington, and Wyoming) participated in the perception study. This is a concern because this region is a strong employer of technical communicators.
Two areas also had much greater participation: Canada (15.1% in this study versus 10.2% in the census) and the Mid-Atlantic region of the United States (Delaware, District of Columbia, Maryland, New Jersey, Pennsylvania, Virginia, and West Virginia) (27.3% in this study versus 10.6% in the census).
Other than those exceptions, participation rates were generally the same across regions suggesting some level of similarity between the organizations represented in the two studies. Table 3 identifies the geographic regions of organizations in which participants in this perception study work and compares that with the results of the 2018 census.
 Conclusion
Although the size of the sample for this study is smaller than we had hoped, the types of employers represented share sufficient similarities with those for which technical communicators work that an alignment exists between the two. That suggests that the results of this study provide insights into the perceptions of technical communicators that all technical communicators should consider as they work with their customers. But note that these are just insights to consider; the results of this study do not broadly generalize.
SAUL CARLINER (saulcarliner@hotmail.com) is a professor of educational technology at Concordia University in Montreal, a past editor of the IEEE Transactions on Professional Communication, and a Fellow and Past President of STC.
YUAN CHEN (yuan.chen@mail.concordia.ca) is a PhD candidate in educational technology at Concordia University, where her research focuses on the perceptions of instructional designers in higher education held by the faculty who work with them. She is also an instructional designer at Carleton University.