By Saul Carliner | STC Fellow and Yuan Chen
One of the ongoing challenges in the technical communication profession is identifying what technical communicators do and the tools with which they work. It sounds like a simple question, but it has been the subject of STC committees, university research studies, and countless articles in professional magazines and blog posts.
Previous studies have either used methods that limit the number of people who can participate, or they have focused on a particular type of communicator (such as user assistance specialists) or a particular issue (such as technology).
The next part of the census provides a comprehensive portrait of the jobs of technical communicators: job roles and reporting relationships, work practices, and job-related perceptions. The results could differ from your own work situation.
Job Roles and Reporting Relationships
What are the primary job roles and reporting relationships of technical communicators? This first section explores the primary job roles of technical communicators, job titles, most common work responsibilities, and the department to which technical communicators report.
Primary Job Role
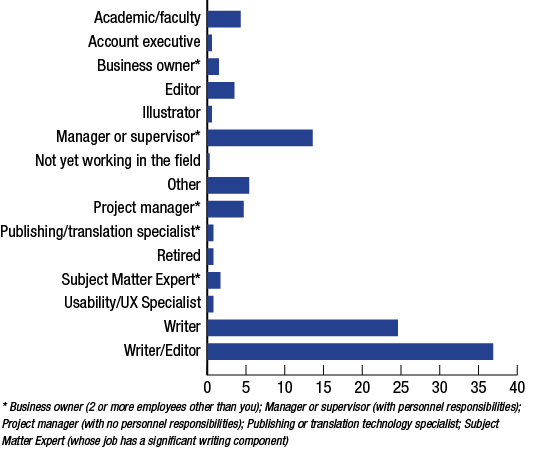
As also noted in the first article of this issue, the majority of the participants in the census (62 percent) identify their primary job as a writing role: 37 percent as writers and another 25 percent as writer/editors. The next largest group of participants identify their job role as management (14 percent). Other traditional roles identified with technical communication represent just small percentages of the census participants: project managers represented 5 percent, editors (without writing responsibility) 3.5 percent, subject matter experts who have writing as part of their responsibility 2 percent, and business owners (with two or more employees other than the participant) represented 1.5 percent. Also as noted in the first article in this issue, illustrators and UX specialists represent just 0.6 percent and 0.8 percent (respectively) of the participants. Figure 1 shows the primary job roles of technical communicators.
Job Titles
About a third of the participants shared their job titles. Of those, 46 percent had the term “technical writer” (most common), “editor,” or “communicator.” About 5 percent use “information developer” in their job title, and another 5 percent incorporate the term “documentation” into their titles. Only three participants had the term “content” in their job titles: one content architect, one content developer, and one content strategist.
About 25 percent of the participants were in a senior role. The majority use the term “senior” to indicate this status, but 3 percent each use the terms “principal” and “lead” to do so.
Work Responsibilities
To get a sense of the key work responsibilities of technical communicators, we asked them to identify their top three work responsibilities. Developing content is the most prominent work responsibility of participants in the census: a primary job responsibility of 48 percent of participants, a secondary responsibility for 17 percent, and a tertiary responsibility for another 10 percent.
Editing is the second most prominent work responsibility, with 12 percent identifying it as a primary responsibility, 31 percent as a secondary responsibility, and 15 percent as a tertiary responsibility.
Management is the third most prominent work responsibility. Eleven percent of participants in the census identified it as their primary job responsibility, and 2 percent identified it as a secondary or tertiary responsibility.
Project management (with no personnel responsibility) is the fourth most prominent work responsibility, with 8 percent of participants identifying it as a primary responsibility, another 8 percent as a secondary responsibility, and 9 percent as a tertiary responsibility.
Planning the strategy for an organization’s content is the primary work responsibility of just 6 percent of participants, but a secondary responsibility for 16 percent, and a tertiary responsibility for 20 percent of participants.
By contrast, only two participants (0.3 percent) identified providing usability services as a primary job responsibility. Another 2 percent identified that as a secondary responsibility, and 5 percent identified it as a tertiary responsibility. Figure 2 shows the work responsibilities of technical communicators.

Department to Which Technical Communicators Report
As noted in the previous article in this issue, the census results suggest 40 percent of technical communicators work in one of two departments within organizations: information technology and information services (IT/IS) (21 percent) and research and development (19 percent). Only 6 percent work in the manufacturing department and 5 percent in the marketing and sales department. 22 percent work in another department.
Work Practices
What do technical communicators do in their jobs? That is, what products do they produce, what work practices do they follow, and what technologies do they use? The next section reports what the census found.
Products Produced
To get a sense of the most common types of work products produced by technical communicators, the census asked participants to identify from a list as many as many as five types of products on which they worked most during the previous 12 months. The most common was user guides, on which 66 percent of participants worked during the past 12 months. Second was help and user assistance topics (52 percent), reference material (46 percent), tutorials and training materials (45 percent), and policies and procedures (40 percent).
The least common products included chatbots (just 2 percent of participants produced them), scientific reports (7 percent), social media content (9 percent), white papers (9 percent), and newsletters (12 percent).
Table 1 ranks the work products produced by technical communicators.
Work Practices
Work practices, such as structured writing, translation, and agile methodologies, also play a major role in the work of technical communicators. To get a sense of the extent to which several practices that are well covered in professional and peer-reviewed publications in the field affect the work of technical communicators, the census asked participants to identify the extent to which six practices affect their current work projects or, for those between jobs, their most recent work projects.
The work practice that affects technical communicators most are technical communication standards, which affect 45 percent of participants to a great extent and another 37 percent to some extent. The work practice that most affects technical communicators next is structured writing. By contrast, the practices that affect technical communicators least are translation and printing (66 percent of participants indicated that these practices affect them minimally or not at all). Table 2 shows the extent to which the six work practices affect technical communicators.
Note that some participants did not respond to the question, so the percentages do not add up to 100 percent.
Table 1. Products produced by technical communicators.
Products Produced in the Past 12 Months |
Rank |
Percentage Who Produce Them |
|---|---|---|
User guides |
1 | 66 percent |
Help and user assistance topics |
2 | 52 percent |
Reference material |
3 | 46 percent |
Tutorials and training materials |
4 | 45 percent |
Policies and procedures |
5 | 40 percent |
Knowledge bases |
6 | 31 percent |
Product specifications |
7 | 26 percent |
Employee communication materials |
8 | 26 percent |
User interfaces |
9 | 25 percent |
Marketing information |
10 | 20 percent |
Other |
11 | 16 percent |
Proposals |
12 | 15 percent |
Newsletters |
13 | 12 percent |
White papers |
14 | 9 percent |
Social media content |
15 | 9 percent |
Scientific reports |
16 | 7 percent |
Chatbots |
17 | 2 percent |
Table 2. Extent to which practices affect technical communicators.
To a great extent |
To some extent |
Minimally |
Not at all |
|
|---|---|---|---|---|
Technical communication standards |
45 percent | 37 percent | 9 percent | 5 percent |
Structured writing |
37 percent | 27 percent | 14 percent | 18 percent |
Agile |
29 percent | 23 percent | 16 percent | 28 percent |
Translation |
15 percent | 16 percent | 20 percent | 46 percent |
Printing |
10 percent | 22 percent | 32 percent | 34 percent |
Other |
30 percent | 40 percent | 17 percent | 10 percent |
Technologies Used
Technology also plays a major role in the work of technical communicators. To get a sense of the technologies used most, the census asked participants to identify from a list as many as seven technologies with which they worked most during the previous twelve months.
The most widely used technology by participants was word processing, used by 76 percent of participants. Next were Acrobat (66 percent), spreadsheets (65 percent), presentation graphics (51 percent), and graphics (43 percent).
The least commonly used technologies are storyboarding or wireframing, used only by 4 percent of participants. The next least-used technologies included engineering graphics (6 percent), translation management systems (7 percent), video and sound editing (8 percent), and database (9 percent) technologies. Table 3 ranks the technologies used by technical communicators.
Table 3. Technologies used by technical communicators.
Technology |
Rank |
Percentage Who Use It |
|---|---|---|
Word processing (such as Word and Google Docs) |
1 | 76 percent |
Acrobat |
2 | 66 percent |
Spreadsheet (such as Excel and Google Sheets) |
3 | 65 percent |
Presentation (such as PowerPoint and Apple Keynote) |
4 | 51 percent |
Graphics (such as Photoshop and Illustrator) |
5 | 43 percent |
Cloud storage (such as Dropbox, OneDrive and Google Drive) |
6 | 42 percent |
CMS (SharePoint) |
7 | 32 percent |
Collaboration tools (such as MS Teams and Slack) |
8 | 31 percent |
Help authoring (such as MadCap Flare, and RoboHelp) |
9 | 31 percent |
Desktop publishing (such as InDesign and FrameMaker) |
10 | 30 percent |
Web development (Dreamweaver, HTML, CSS, JavaScript) |
11 | 21 percent |
Component Content Management System—proprietary |
12 | 20 percent |
eLearning authoring (such as Camtasia, Captivate, and Storyline) |
13 | 19 percent |
Project planning (such as Visio) |
14 | 18 percent |
Other |
15 | 15 percent |
Open Content Management System (such as Drupal or WordPress) (tie) |
16 | 14 percent |
DITA (Darwin Information Typing Architecture) (tie) |
16 | 14 percent |
Database (such as Access and MySQL) |
18 | 9 percent |
Video and sound editing (such as Premier, Avid, and Audacity) |
19 | 8 percent |
Translation management system |
20 | 7 percent |
Engineering graphics (such as AutoCAD) |
21 | 6 percent |
Storyboarding/wireframe (such as Axure) |
22 | 4 percent |
Job-Related Perceptions
Although an article later in this issue explores in-depth the perceptions that technical communicators hold of their jobs and careers, this section reports on some particular perceptions of the feedback received on their work, the time available to perform their jobs, and their general job satisfaction.
Perceptions of Feedback Received on Work
In general, participants feel they receive feedback on their work. Sixty-five percent of participants either agree or strongly agree with the statement, “My superiors provide me with feedback on my work. (For those who are employed, superior is your supervisor or manager; for those who are contractors or self-employed, your superior is your client or the person who places you in positions, such as a recruiter).” More than a third, however, feel that they do not receive feedback, with 19 percent disagreeing or strongly disagreeing with the statement about feedback and another 16 percent neither agreeing nor disagreeing.
Perceptions of Time Available to Perform Jobs
By contrast, participants in the census seem to have mixed feelings about whether they have sufficient time to produce content. Forty-six percent of participants agree or strongly agree with the statement, “My employer provides sufficient time to produce the content needed by our users.” Of the remaining participants, 30 percent either disagree or strongly disagree, and 24 percent neither agree nor disagree.
Satisfaction with the Job
Despite these concerns, the overwhelming majority of participants are satisfied with their current jobs. Seventy percent of participants agree or strongly agree with the statement, “I am satisfied with my current job in technical communication.” Of the remaining participants, 12 percent neither agree nor disagree, and 18 percent disagree or strongly disagree.
What Does This Mean?
This basic analysis of the jobs and work practices from the census suggests the following:
- Core work of the field is in writing, editing, or overseeing writing. This is reflected in the job roles and primary, secondary, and tertiary work responsibilities. Other roles exist, but these roles dominate. Not surprisingly, technical writer or communicator is the most common job title.
- Core work products are traditional technical communication products, such as user guides, help systems and user assistance, reference materials, tutorials and training materials, and policies and procedures. To produce them, standards and structured writing play major roles; translation, not so much. And printing—once central to technical communication groups—plays a limited role in the work. The most widely employed technologies include the key components of general use office applications, as well as a publishing tool (Adobe Acrobat) and graphics tools.
- Technical communicators could use more time to complete their work, but they feel they receive feedback and are, in general, satisfied in their jobs.
Although the census provides insights into core nature of the work of technical communicators, it has its limitations. Most significantly, it only provides a broad picture; it does not provide deep insights into the unique characteristics of the jobs of each individual technical communicator.