By Riccardo Mazza
Visualizing information allows us to convey complex ideas quickly and easily. With a deeper understanding of how people decode and process information, we can use careful design to minimize visual clutter and make visualizations simpler and easier to interpret.
Nowadays, we are overwhelmed by data. The diffusion of information and communication technologies, and the advent of internet and mobile devices have produced a quantity of information at an unprecedent rate. It was estimated that by 2020, for every person on Earth, 1.7 megabytes of data would be created every second.1 This proliferation of data implies that being able to present complex, technical information is more important than ever — and we can do it more effectively by presenting information in a visual format. Information visualization, also called data visualization, is a discipline concerned with how complex technical information can be represented in graphical format, so that it can be understood and consumed in a
useful way.
The Picture Superiority Effect and Human Perception
When data is represented graphically, we can exploit the “picture superiority effect.” The picture superiority effect is a phenomenon in which people learn and retain information much better when it comes in the form of images rather than words.2 It takes advantage of our innate perceptual abilities to explore, communicate, and make sense of complex phenomena. This is because the human brain can perceive particular data features and unveil the underlying structure most effectively when the data is expressed graphically.3 The picture of superiority effect is illustrated in Figures 1 and 2.
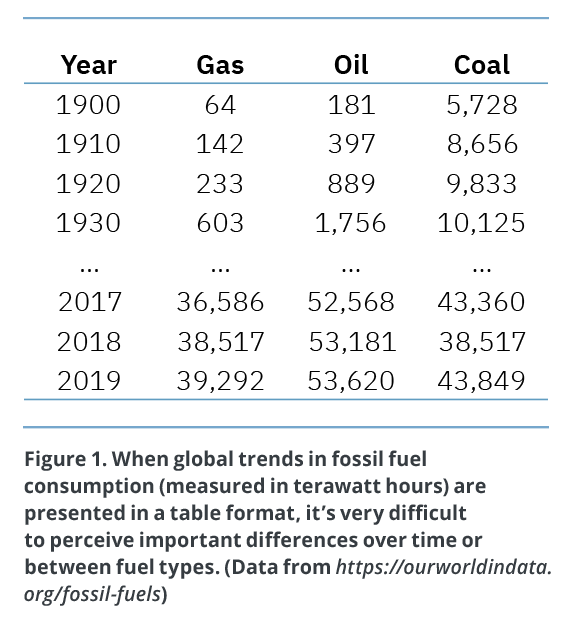
In Figure 1, the extract from a data table representing fossil fuel consumption over the past century can’t make explicit what we immediately see from the graph in Figure 2 — the progression of fossil fuels consumption over the last century and the transition from coal as the primary fuel source towards a combination of fuels that includes oil, gas, and coal, with oil as the primary fuel source.
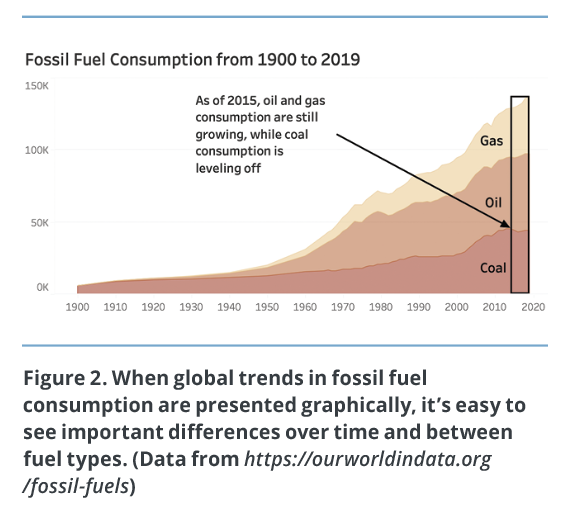
The table is more difficult to interpret as it requires users to read the numbers, and reading is a complex process that requires a lot of cognitive effort. The table also forces the user to figure out which elements are important, rather than showing the user which elements are important with carefully selected visual attributes. The graph draws the user’s attention toward the relative decrease in coal consumption in recent years with the label and arrow, as well as the highlighted area on the right. This is the intended takeaway of the visualization.
Maximizing Pre-Attentive Processing
When we look at the graph in Figure 2, we immediately perceive the huge increase of fossil fuel consumption over the last half-century. Some visual attributes, like the slope of lines in a line chart, the length of bars in a bar chart, the size and shape of a form, the color of a mark, the width of a line, and the motion of objects, are immediately identified and processed through vision, even before the complex cognitive processes of the human mind come into play. These attributes are called “pre-attentive,” as they are perceived by the user almost instantaneously, without the intervention of conscious thought.4 Enhancing these attributes so that they stand out from their surroundings, particularly for the most important data elements, draws the attention of your users and creates visual cues that can be processed pre-attentively.
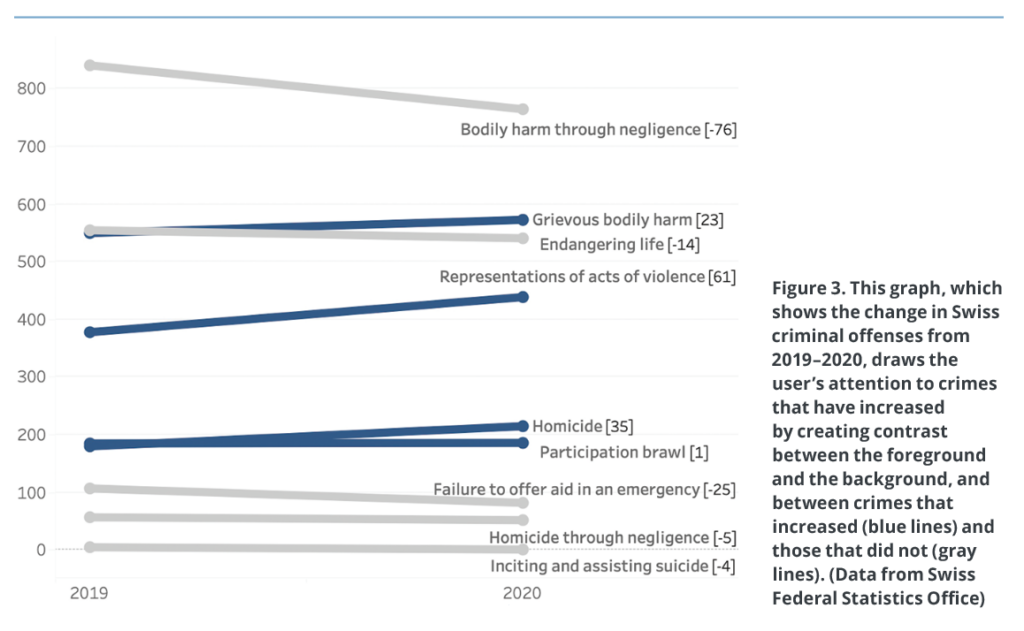
Let’s suppose we want to create a graph that shows which criminal offenses increased in Switzerland from 2019–2020. Figure 3 shows a slope graph where each crime type is mapped with a line, and differences are encoded through the slope, as well as quantitively with the numbers shown in brackets. Our brain is very good at comparing the slopes of different lines, hence our immediately perceiving increases, decreases, and amounts.
To create further emphasis, the types of crimes that increased in 2020 are also presented as blue lines, which increases contrast and attracts the user’s attention almost immediately. In addition, the types of crimes that did not increase are presented as gray lines — gray is a neutral color that naturally recedes into the background. Notice how we chose to use just two different colors, rather than several different colors, to avoid distracting the user with unnecessary clutter. We also chose a neutral grey for the thin, horizontal background lines, which creates contrast with the thicker foreground lines, and further directs the user’s attention to the data we wish to emphasize. Colors should always be used with purpose and intent.
Graphical elements should be carefully selected, as certain elements are more effective than others for conveying specific types of information. For example, varying the lengths of bars and the position of objects on an axis are both excellent for encoding quantitative values. Lines are useful for displaying data over time. Altering the color and size of a shape is more suitable for encoding qualitative measures and for drawing the user’s attention.
Minimizing Cognitive Load
When we look at a graphical representation, we see with our eyes, but we actually create meaning from what we see in our brain. Most of the decoding and processing of information from visualization happens in our short-term memory. This is also called “attentive processing,” because it requires conscious mental effort, and users have to direct their attention and engage their memory to interpret the elements of the graphical representation. Most people can only retain 3–7 pieces of visual information in their working memory at any given time.5 To avoid cognitive overload, we should limit the number of information items and avoid unnecessary and decorative elements. A careful design minimizes visual clutter, making the visualization simpler and easier to interpret.
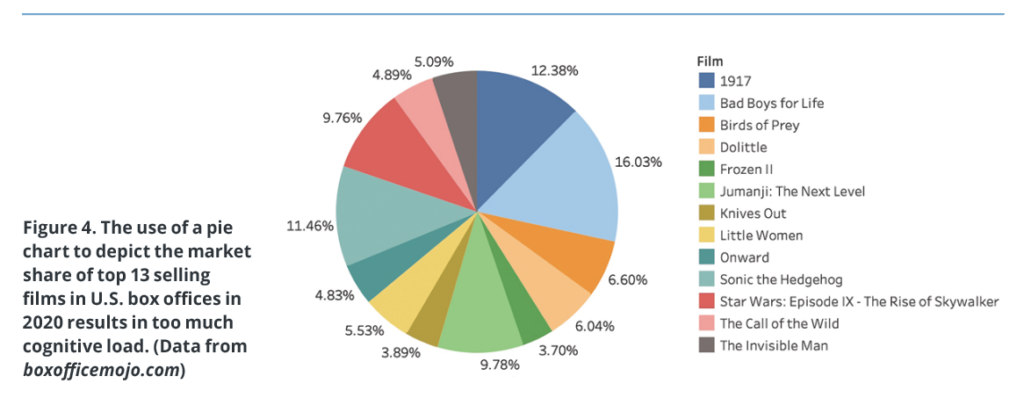
For example, if we want to create a visualization of the market share of the top 13 selling films in U.S. box offices in 2020, we may decide to use a pie chart (Figure 4). Pie charts are often used to show relative proportions and percentages. However, pie charts pose some important issues. Particularly, we read pie charts by area of the slices,6 and research shows that our visual perception is not good at accurately assigning quantitative values to areas, and that shapes are difficult to compare if they are close in size.7,8 Moreover, color-coded labels force the user to continuously glance back and forth between the legend and the pie, and people who are color blind may not be able to distinguish one element from another. This not only requires more effort for interpretation but can also result in ambiguity and misinterpretation.
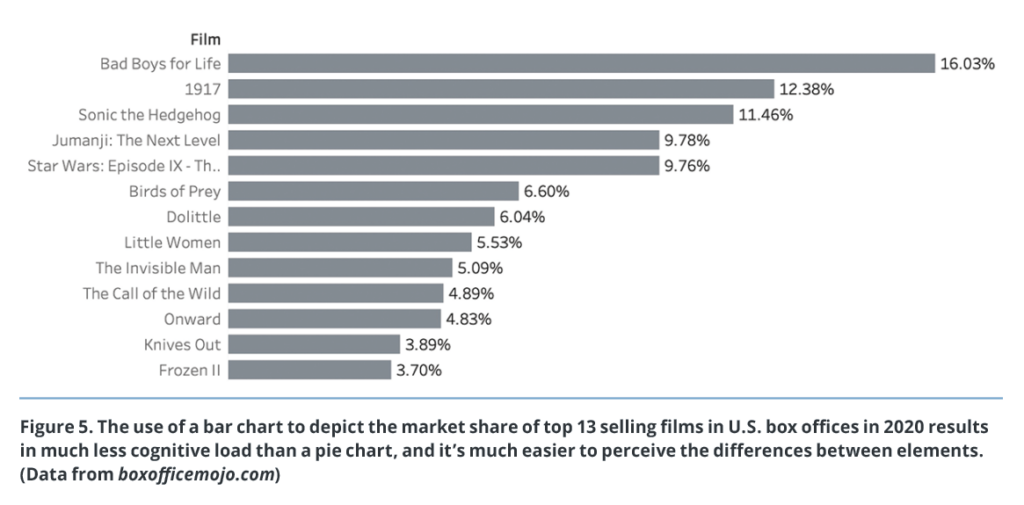
In contrast to the pie chart, a bar chart (Figure 5) makes comparing items much easier, and the relationships between elements are much more apparent. As a general rule, when the number of items is more than three, or when you want to evaluate the relative size of items, a pie chart should always be replaced by a simple (and more effective) bar chart. Because the bars are plotted on a common baseline, the comparison of values is much easier.
Designing Information Visualizations
One question people often ask when approaching information visualization is, “How do I create a good information visualization?” It’s a nuanced process that involves multiple variables and making the type of distinctions and decisions that only the human brain can make. There are no rote recipes for effective information visualization, but you can cultivate these skills by developing a deeper understanding of the science behind vision, perceptual psychology, and cognitive science. Good visualization should convey complex data to the user clearly, efficiently, and without distractions. But above all, it should be useful to users who are seeking to answer a question or solve a problem. Visualization design should be guided by a clear understanding of the intended audience and how the visualization serves the needs of that audience. When designing visualizations, ask yourself, “Do I want my users to make an informed decision based on the data?” Or to learn something? Or simply to reflect on the data?
Conclusion
Creating a good visualization is a matter of substance and simplicity. Above all, visualizations should serve a clear purpose. Just because you have data available does not mean that you should represent everything in visual format. When designing a visualization, make design choices that are based on target audiences. What does your audience expect from a visualization? What is the desired outcome? What is the insight you want to convey? Maybe we want to show a trend over time (Figure 2), emphasize a particular relationship between data items (Figure 3), or show how distinct parts are arranged to form a whole (Figures 4 and 5).
Choose relevant data and a visual format that minimizes cognitive load by triggering automatic (pre-attentive) recognition, rather than requiring conscious (attentive) interpretation. Avoid cluttering the visualization with unnecessary background elements, chart borders, gridlines, or decorations. Use labels, colors, and other attributes that draw attention to important information and account for the limits of human perceptual abilities. Remember that there is always something interesting in a data set, and you just need to understand what is relevant to your users.
Learn More
If you’re interested in learning more about information visualization, perception, and cognition, please refer to the works of Edward Tufte,3,9,10 Stephen Few,5,8,11 and Riccardo Mazza.12 g

RICCARDO MAZZA (riccardo.mazza@supsi.ch) is senior lecturer at the University of Applied Sciences and Arts of Southern Switzerland in Lugano (Switzerland), where he teaches computer graphics and data visualization. Graduated in Computer Sciences at the University of Pisa (Italy) in 1997, he holds a Ph.D. in Communication Sciences from the University of Lugano with a dissertation on the visual representation of student data in web-based distance education, pioneering research in learning analytics in 2001. He is also the author of the book Introduction to Information Visualization, edited by Springer-Verlag in 2009. His main research interests include information and data visualization, learning analytics, and distance education.
References
- Domo Inc. n.d. “Data never sleeps 6.0. How much data is generated every minute?” https://www.domo.com/assets/downloads/18_domo_data-never-sleeps-6+verticals.pdf
- Paivio, Allan. 1971. Imagery and Verbal Processes. New York: Holt, Rinehart, and Winston.
- Tufte, Edward R. 1983. The Visual Display of Quantitative Information. Chesire, CT: Graphics Press.
- Healey, Christopher and James Enns. 2012. “Attention and Visual Memory in Visualization and Computer Graphics.” IEEE Transactions on Visualization and Computer Graphics 18, no. 7 (July): 1170–88.
- Few, Stephen. 2004. Show Me the Numbers: Designing Tables and Graphs to Enlighten. El Dorado Hills, CA: Analytics Press. ISBN 0970601999
- Skau, Drew and Robert Kosara. 2016. “Arcs, Angles, or Areas: Individual Data Encodings in Pie and Donut Charts.” Computer Graphics Forum, 35: 121-130.
- Cleveland, William S. and Robert McGill. 1986. “An Experiment in Graphical Perception.” International Journal of Man-Machine Studies Volume 25, no. 5: 491-500, ISSN 0020-7373
- Few, Stephen. 2004. “Tapping the Power of Visual Perception.” Perceptual Edge.
- Tufte, Edward R. 1990. Envisioning Information. Cheshire, CT: Graphics Press. ISBN 0961392118
- Tufte, Edward R. 1997. Visual Explanations. Cheshire, CT: Graphics Press, Cheshire. ISBN 0961392126
- Few, Stephen. 2021. Now You See It: An Introduction to Visual Data Sensemaking. El Dorado Hills, CA: Analytics Press. ISBN 978-1938377129
- Mazza, Riccardo. 2009. Introduction to Information Visualization. London: Springer-Verlag London. ISBN 978-1-84800-219-7